


The chat logs of AI companies are often used to measure what work AI actually does. This column uses a nationally representative US survey that links generative AI use to workers’ detailed tasks and compares them with task shares derived from Anthropic, Microsoft, and OpenAI chat data. The four sources disagree sharply, largely because chat classifiers cannot see a user’s occupation and therefore classify use into a few generic activities. Chat logs are informative but on their own can misattribute AI use across occupations and cannot substitute for measurement anchored in who the worker is.
Which jobs will generative AI change most, and how? The labour market effects of any new technology depend on the tasks it performs: work that the technology can do tends to lose value, complementary work gains it. Early evidence for generative AI is mixed, with lower earnings for freelance writers and illustrators (Hui et al. 2023) and faster productivity growth but no employment changes in industries with higher adoption on both sides of the Atlantic (Bick et al. 2026b).
Data on what AI does at work are becoming a policy priority. In April 2026, US Senators Mark Warner and Ted Budd introduced the Workforce Transparency Act, which would direct the US Department of Labor, Bureau of Labor Statistics, and Census Bureau to collect and publish data on task- or activity-level AI usage, with the backing of Anthropic, Google, Microsoft, and OpenAI (Warner and Budd 2026).
The most influential evidence so far comes from two places: ‘exposure scores’ that ask which tasks AI could in principle perform (e.g. Eloundou et al. 2024) and the AI companies’ own chat logs, classified into occupational tasks from O*NET (Handa et al. 2025 for Anthropic, Chatterji et al. 2025 for OpenAI, Tomlinson et al. 2025 for Microsoft). A concern with exposure scores is that they depend heavily on which model does the scoring (Yin 2026). Chat logs, we argue in a recent paper (Bick et al. 2026c), face a different problem: they observe the conversation but generally not the worker, and thus not the user’s occupation directly. As a consequence, the classifier often cannot infer the purpose the conversation serves, which is precisely what the O*NET framework is built around.
Measuring what work AI does, worker by worker
Our data come from the Real-Time Population Survey, a nationally representative online survey of US adults that mirrors the Current Population Survey and has tracked generative-AI adoption since August 2024 (Bick et al. 2026a). Since August 2025, the Real-Time Population Survey elicits each worker’s detailed occupation and presents the ten most important ‘detailed work activities’ for that occupation from the O*NET database. Workers indicate which of these tasks they perform and, if they use AI at work, which tasks AI regularly helps with. Pooling four quarterly waves through May 2026 that cover nearly 14,000 workers aged 18–64, we obtain adoption rates for detailed occupations and tasks (the share of workers in an occupation, or performing a task, who use AI for it).
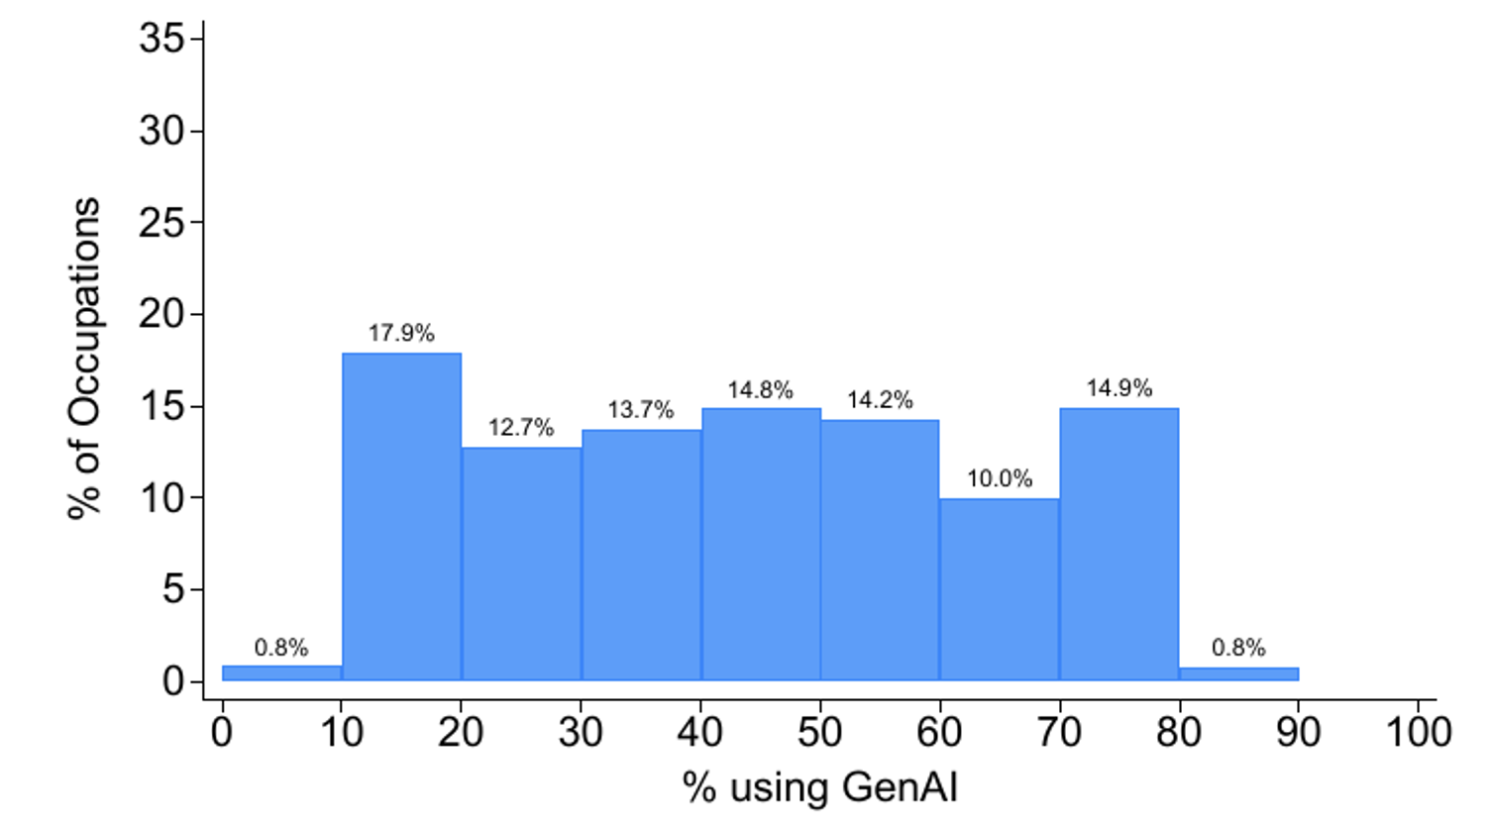
Two results set the stage (Figure 1). First, adoption is widespread: in more than 80% of occupations, at least one in five workers uses AI on the job, and more than 40% of tasks have adoption rates above 20%. Second, adoption is shallow: fewer than 3% of tasks have adoption rates above 50%, and none are above 70%. An implication of this is that most of the variation is between workers doing the same work. Exposure scores explain up to half of the variation in adoption across occupations and tasks, consistent with German evidence (Lindenlaub et al. 2026), but less than 10% across individual workers. Whether AI is used for a given task thus depends far more on who performs it than on the task itself.
Figure 1 Distribution of generative-AI adoption rates across occupations and tasks
a) GenAI adoption rates by occupation (30-digit SOC)
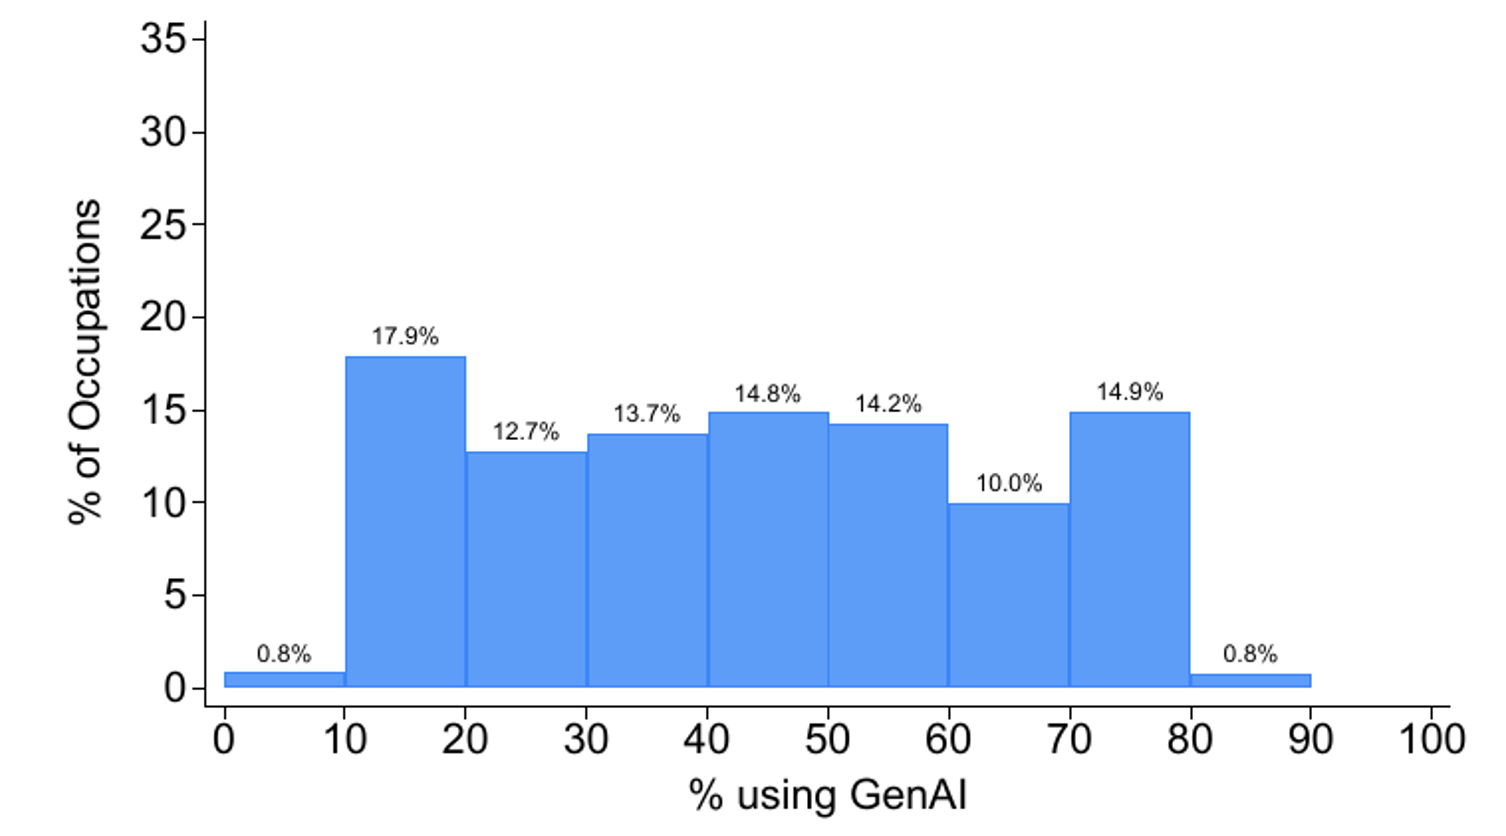
b) GenAI adoption rates by task (DWA)
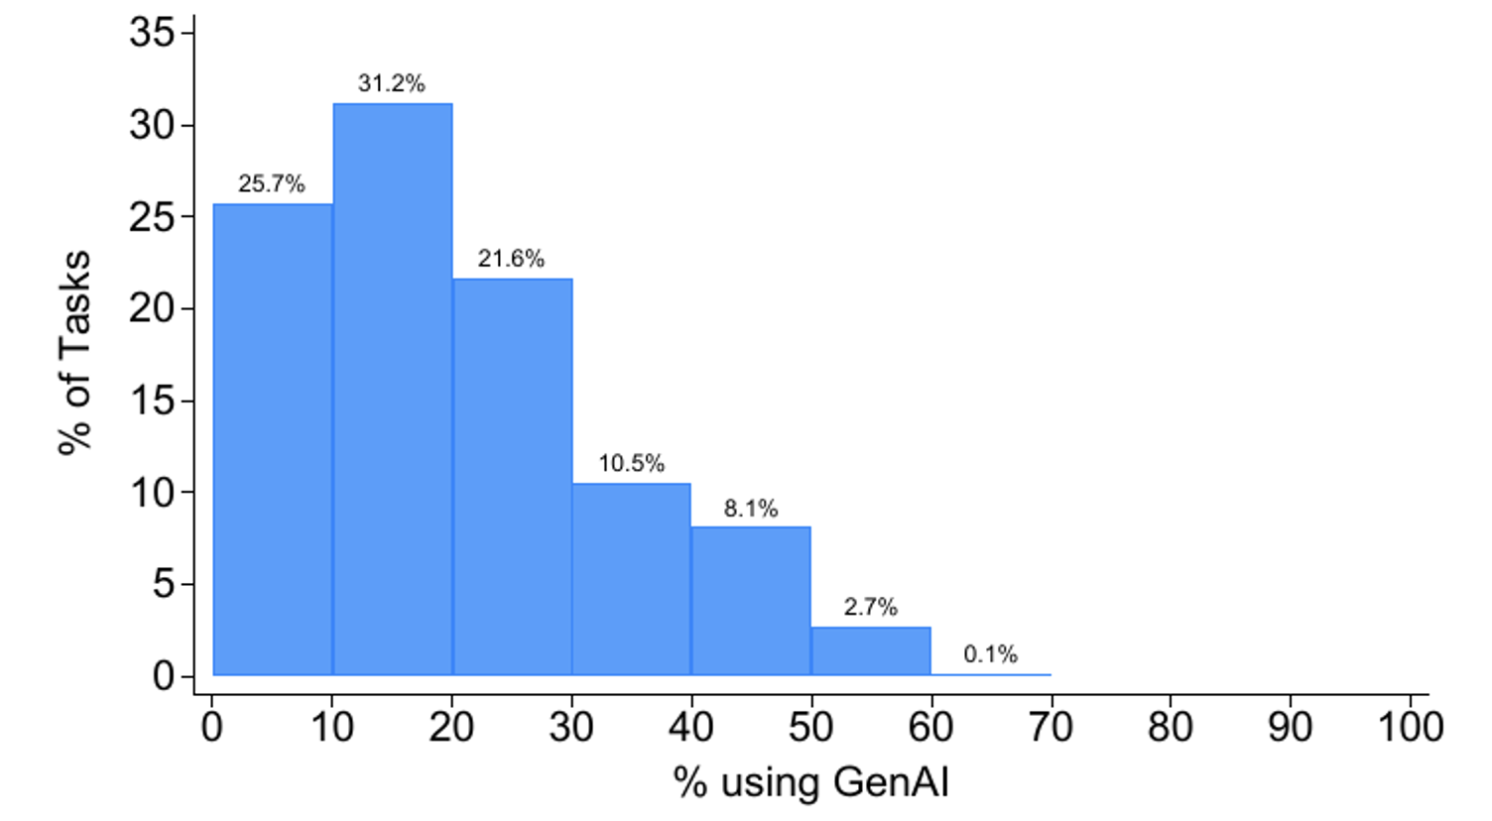
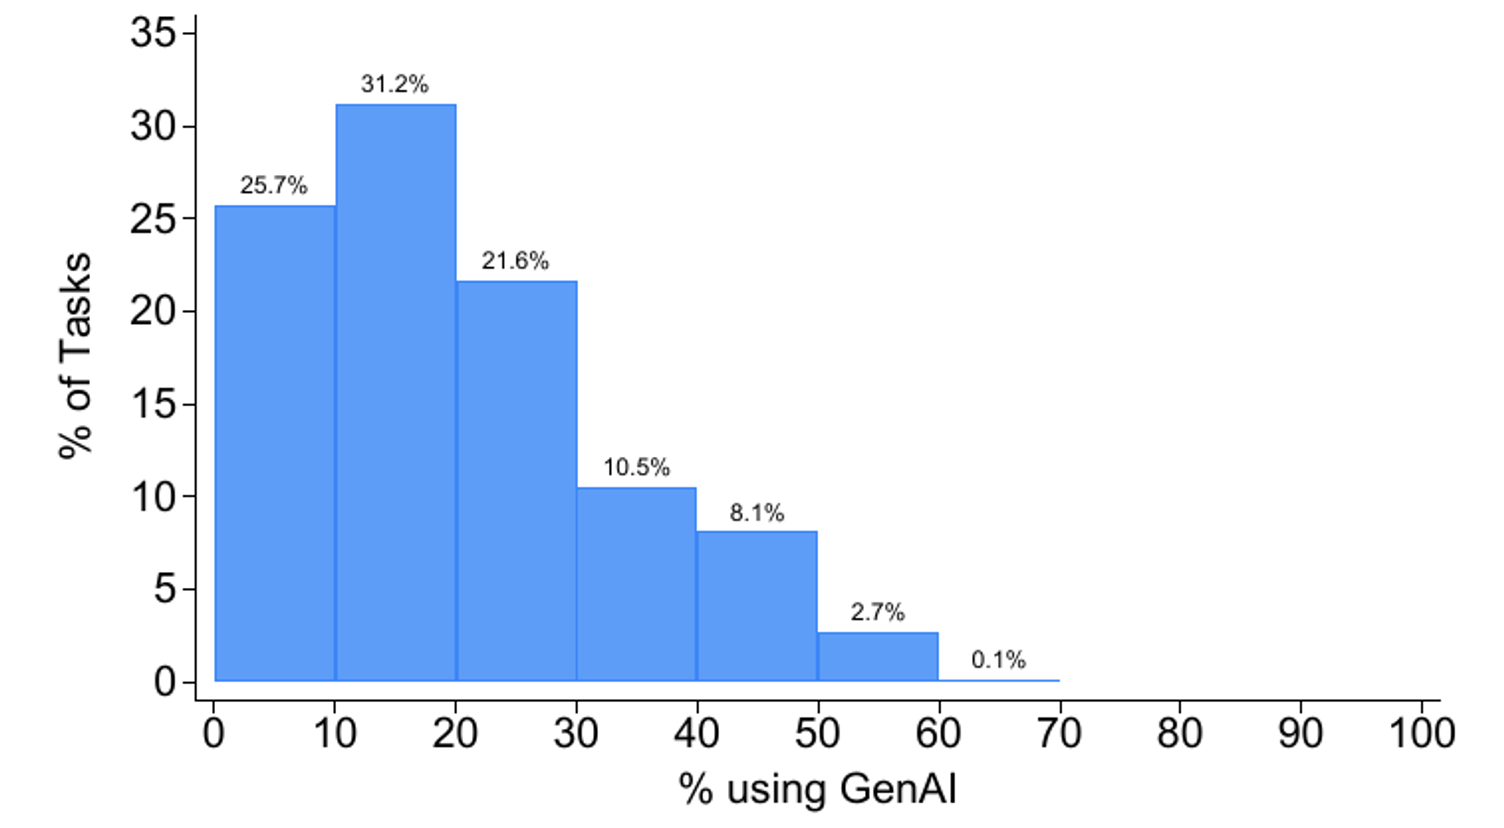
Notes: Panel (a): weighted share of workers in each detailed (3-digit SOC) occupation who report using generative AI for their job. Panel (b): weighted share of workers performing each O*NET detailed work activity who report using generative AI for it. Occupations and tasks with fewer than 20 observations are excluded.
Source: Real-Time Population Survey.
What a chat log can and cannot say
Chat-based measures analyse a sample of a platform’s conversations, classify each into an O*NET task, and report each task’s share of all chats. But a task’s share of chats mixes together how common the task is in the economy and how many of the workers who perform it use AI. Chat data alone cannot separate the two, because they do not contain non-adopters: a task can loom large in chat logs because many people perform it, even if few of them use AI, or because most of those who perform it use AI, even if the task itself is rare.
Because the Real-Time Population Survey measures both how common each task is and how many of the workers performing it use AI, we can construct the survey analogue of a chat share, namely each task’s share of all AI-assisted worker-task pairs, and compare like with like.
Four sources, four different answers
Across 332 intermediate work activities, the correlation between the survey-based task shares and the chat-based shares is 0.34 for Anthropic, 0.10 for Microsoft, and 0.11 for OpenAI. The chat sources agree no better with one another (correlations of 0.08 to 0.38). Aggregating to nine broad activity groups raises the correlations with Anthropic and OpenAI to about 0.6, so part of the disagreement is classification noise, but much of it is not.
A second difference is concentration (Figure 2). In the chat data, the single-largest task accounts for 15%–23% of all use, and the ten largest tasks account for 46%–61%. In our survey, the largest task accounts for 4% and the ten largest for 22%.
Figure 2 Concentration of generative-AI use across tasks: Survey versus chat data
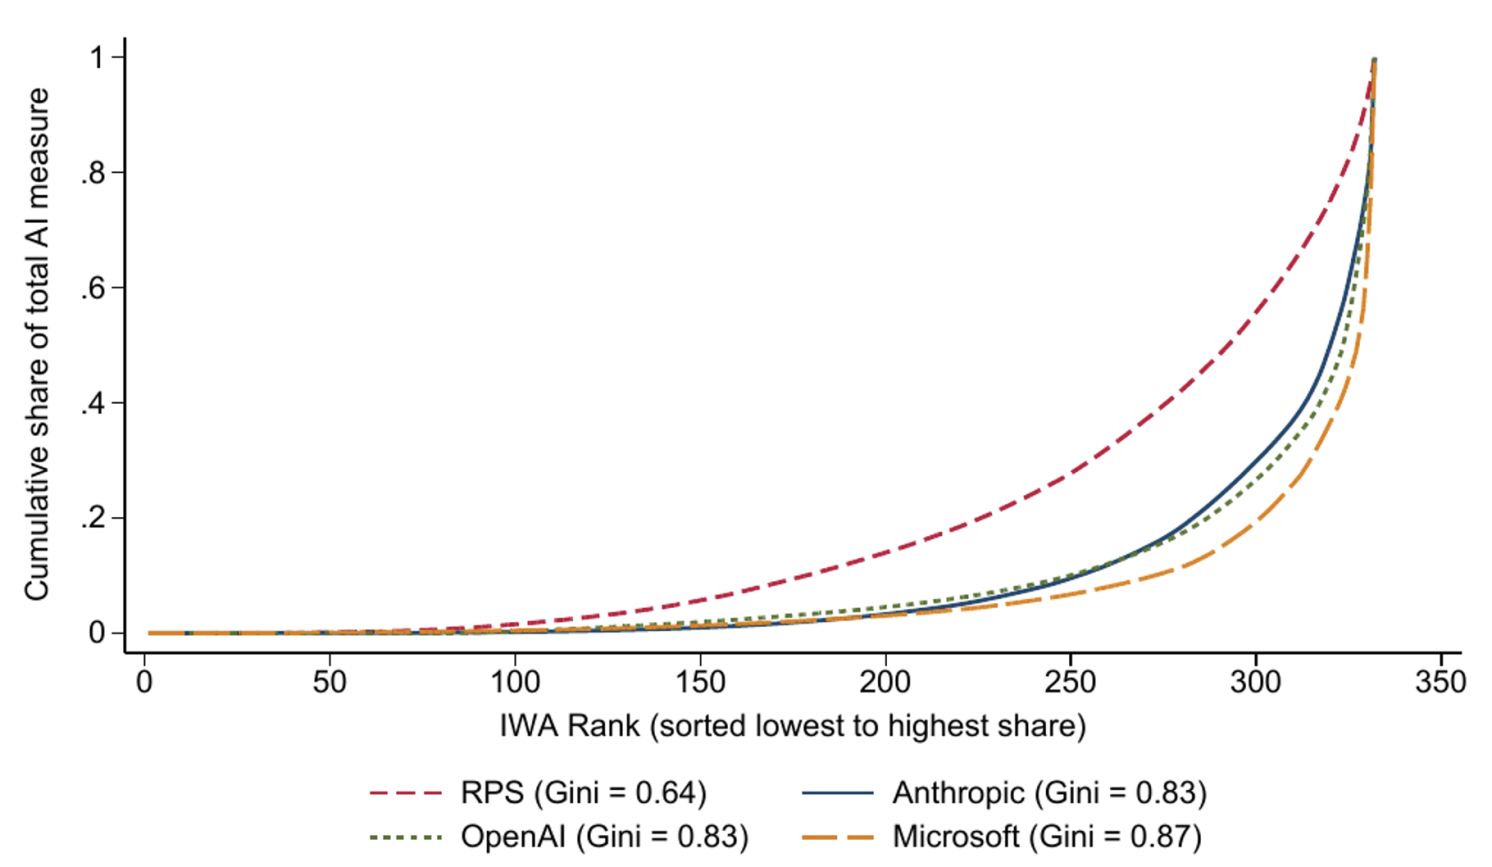
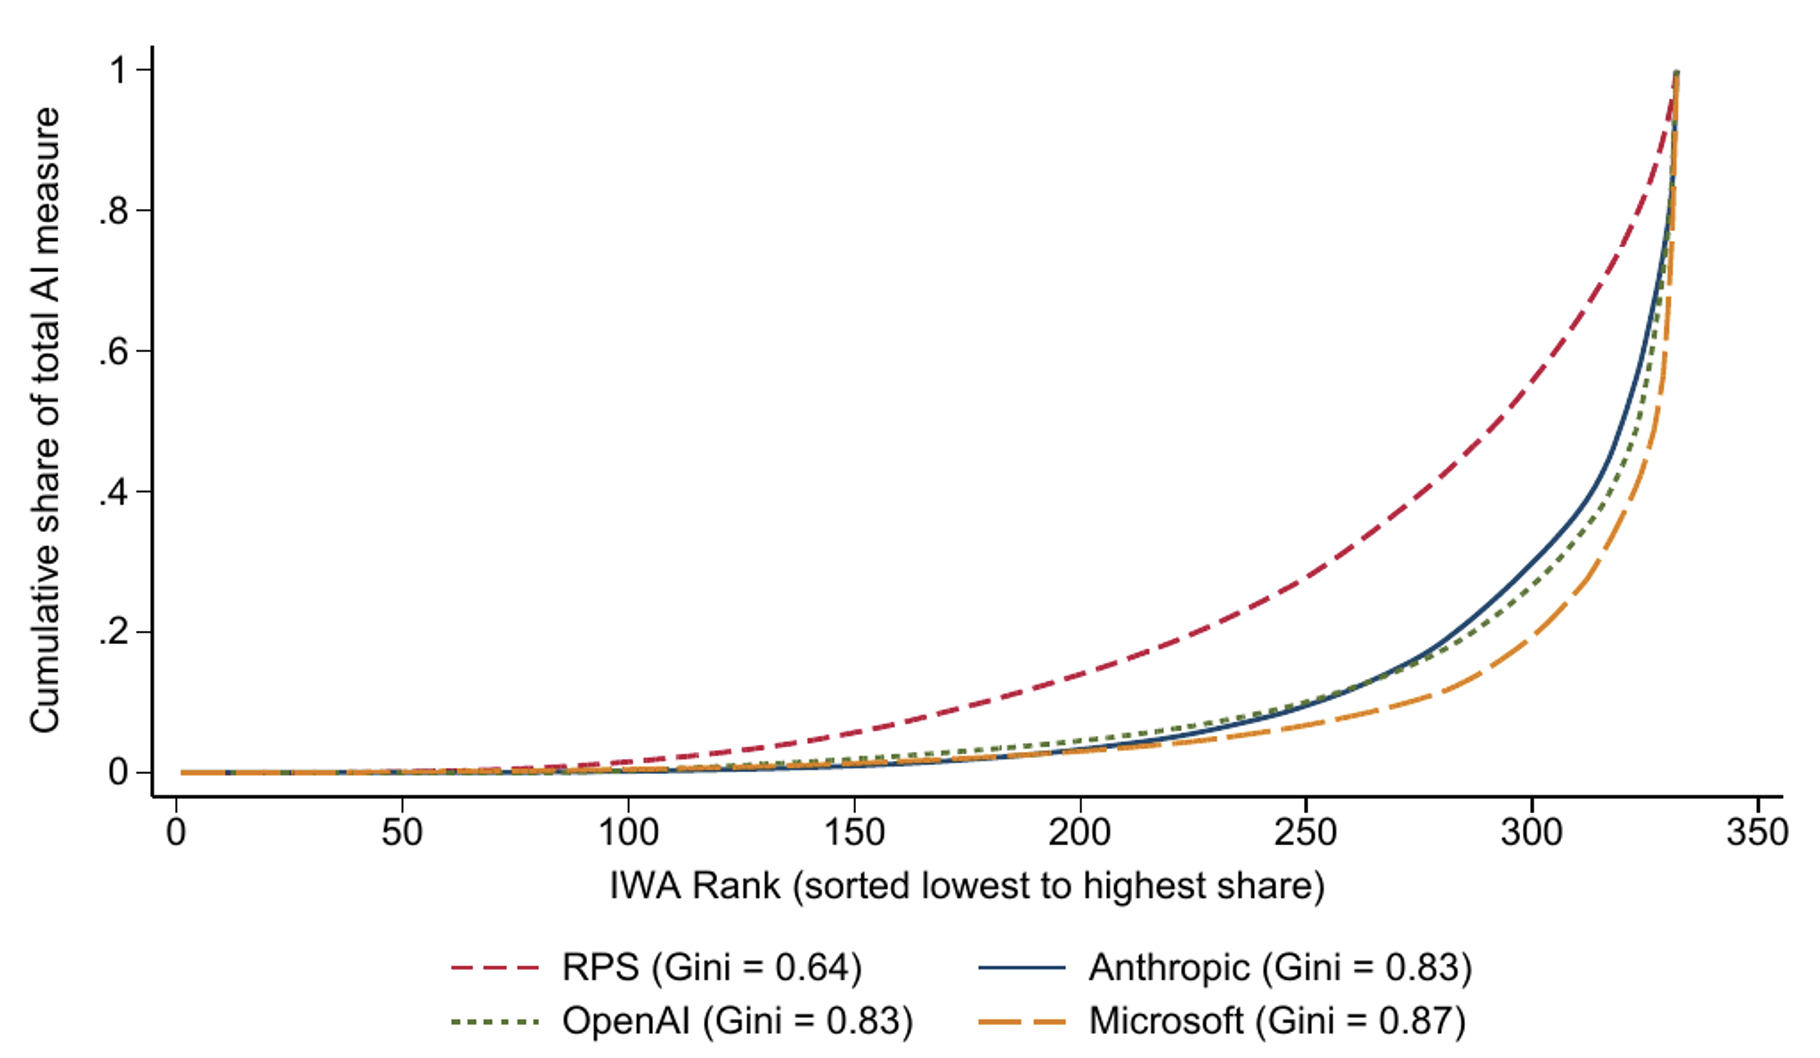
Notes: Cumulative share of AI use by O*NET intermediate work activity, ranked from smallest to largest share.
Sources: Bick et al. (2026c), Chatterji et al. (2025), Handa et al. (2025), and Tomlinson et al. (2025).
Table 1 lists the single-largest task in each source. Each chat source has a different top task, and each describes a basic activity rather than the purpose it serves: ‘edit written materials or documents’ for OpenAI, ‘design computer or information systems or applications’ for Anthropic, and ‘gather information from physical or electronic sources’ for Microsoft. In the Real-Time Population Survey, these tasks have high adoption among the workers who perform them (second-to-last column), but O*NET lists them in only a few occupations (last column), treating them elsewhere as components of purpose-oriented tasks. Editing absorbs over 15% of OpenAI’s work-related chats, yet only 2.4% of US workers are in occupations for which O*NET lists editing as a task. Far more workers edit, of course, but O*NET folds editing into higher-purpose tasks such as preparing reports or drafting legal documents. The survey’s top task, ‘direct organisational operations, activities, or procedures’, is exactly such a purpose-oriented activity. It belongs to occupations covering 43% of the workforce and is almost invisible in chat data.
Table 1 The top generative-AI task in each data source
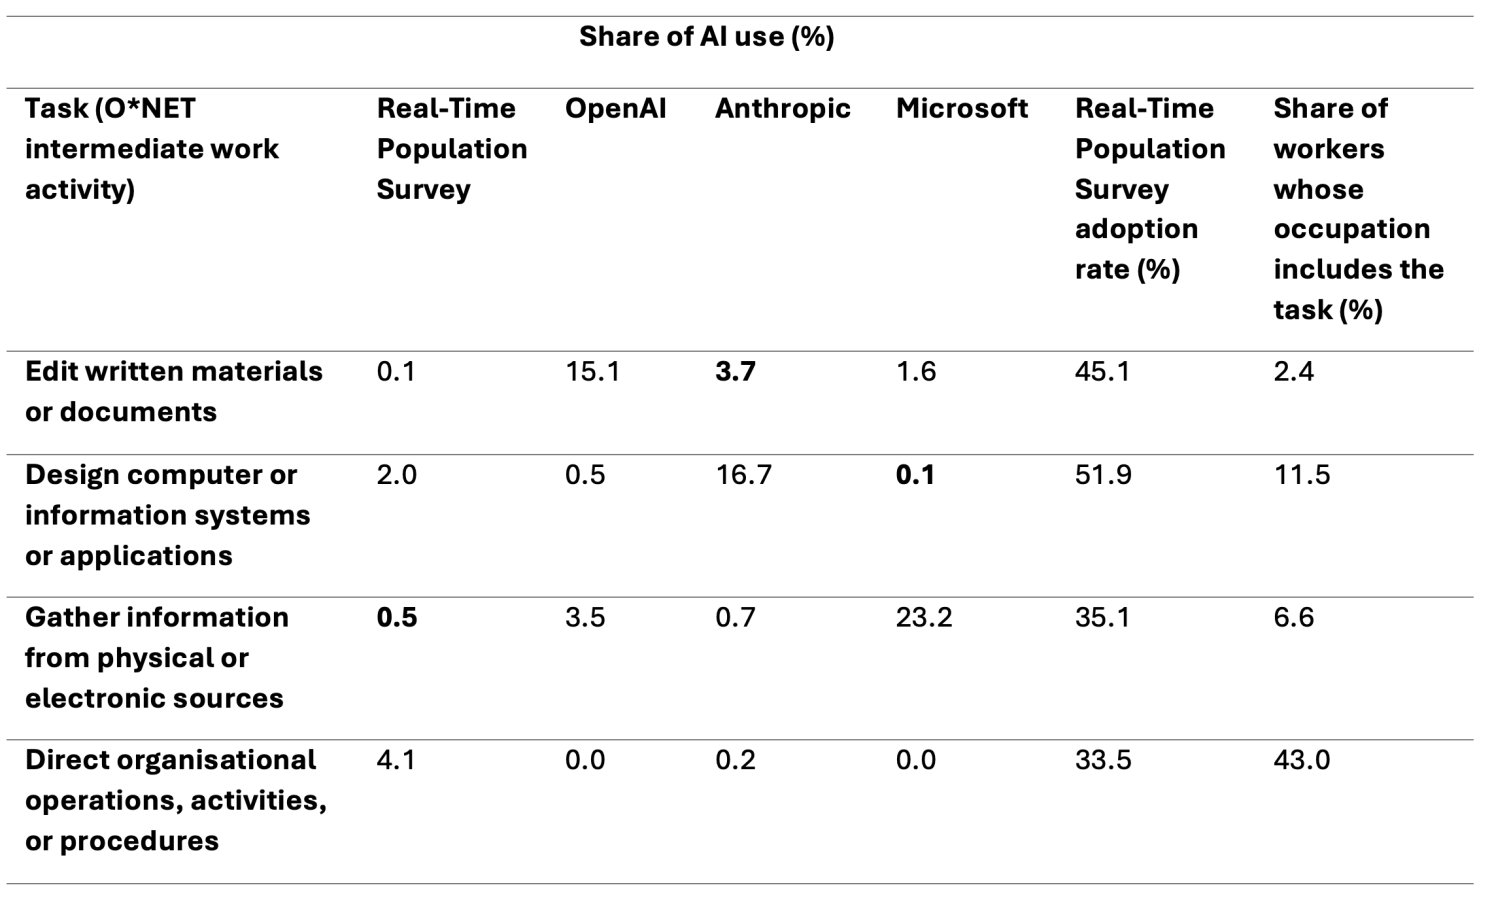
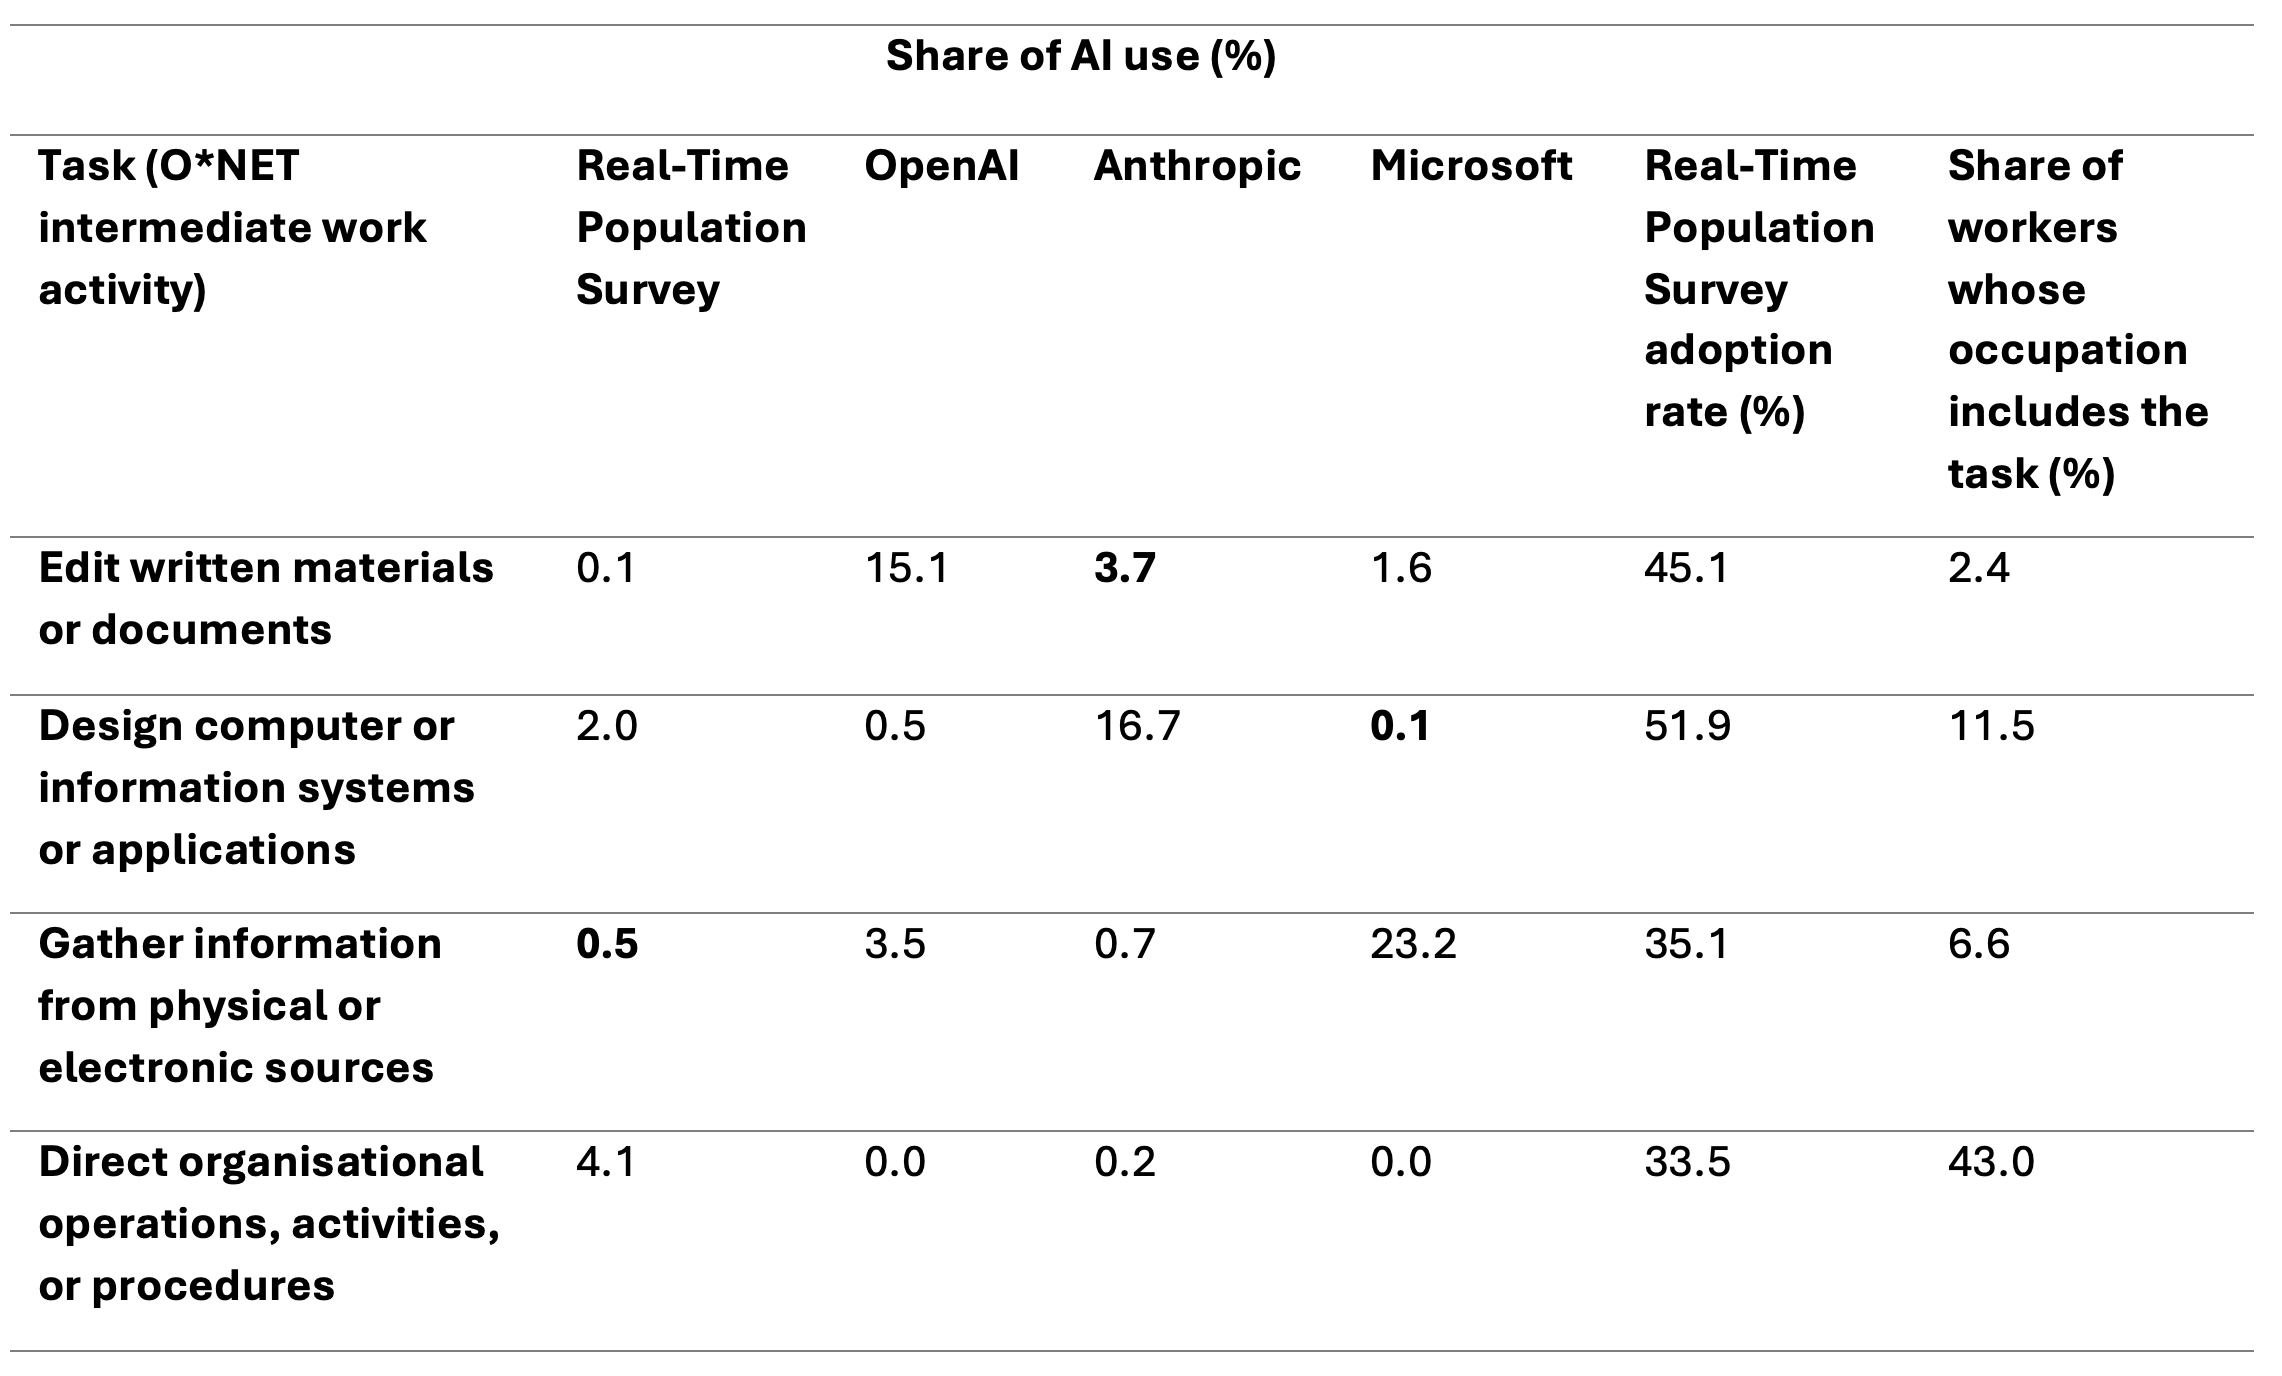
Notes: Rows are the top task in each source (in bold). Shares sum to 100 across all 332 intermediate work activities. Real-Time Population Survey adoption rate: share of respondents performing the task who use generative AI for it. Last column: employment-weighted share of Current Population Survey workers whose occupation includes the task in O*NET.
Sources: Bick et al. (2026c), Chatterji et al. (2025), Handa et al. (2025), and Tomlinson et al. (2025).
Figure 3 makes the mechanism concrete. A professor, for example, asks for help in analysing trends in their data. In O*NET, that work is part of the professor’s task ‘research topics in area of expertise’. A classifier that sees the text but not the user’s occupation will instead file the chat under ‘analyse data to identify trends’, a task O*NET lists for data scientists and analysts but not for professors. The task is misclassified, and because occupations are then inferred from tasks, so is the occupation.
Figure 3 How a task misclassification becomes an occupation misclassification
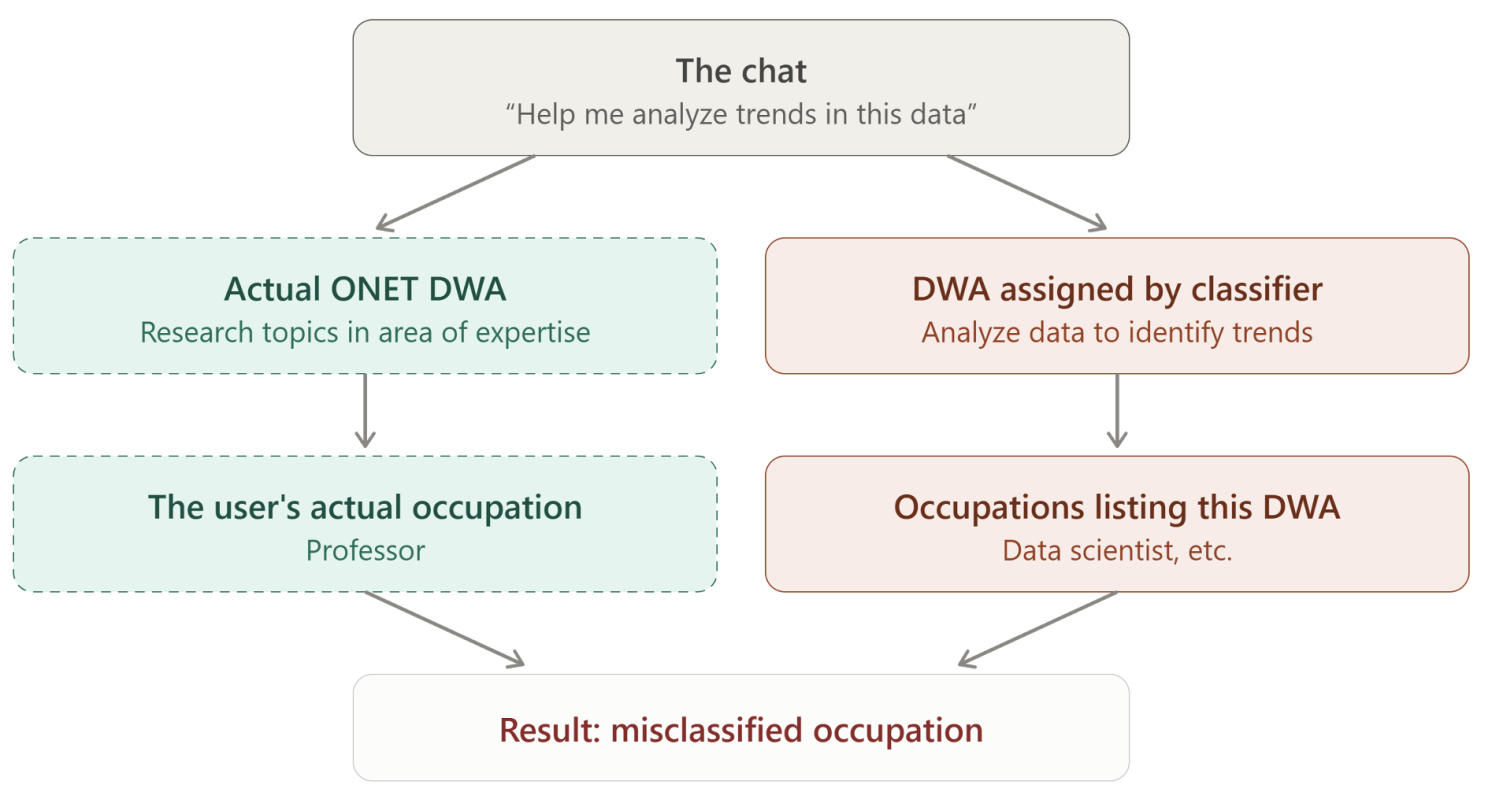
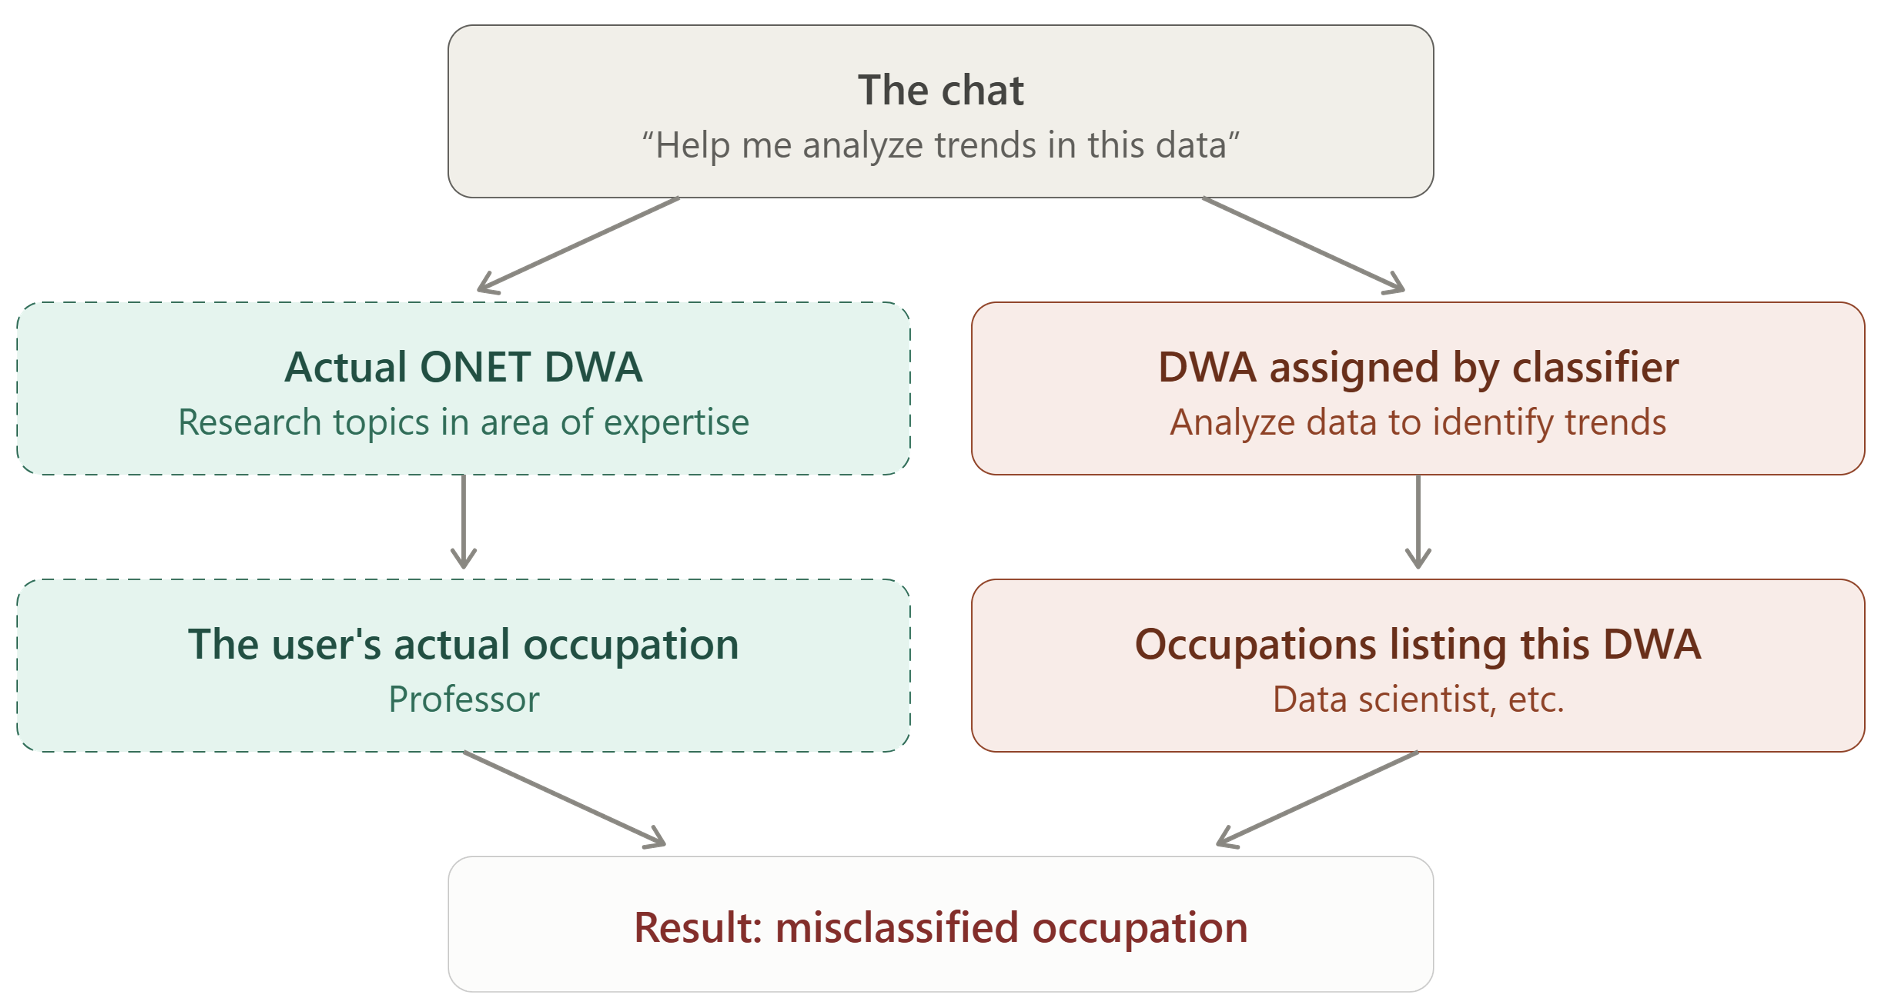
Notes: Illustration of the classification chain for a chat asking for help analysing trends in data.
Source: Authors’ illustration.
Aggregating to broader groups does not help: ‘analyse data to identify trends’ sits under the intermediate work activity ‘analyse scientific or applied data using mathematical principles’ and the broad activity ‘mental processes’, whereas ‘research topics in area of expertise’ sits under ‘maintain current knowledge in area of expertise’ and ‘reasoning and decision making’. Generic task titles thus become catch-all categories that misattribute chats across occupations.
Implications for measuring what work AI does
The comparison carries three lessons. First, occupation-level measures of AI use built by mapping chats to O*NET tasks and then to occupations are likely to misattribute use across occupations because generic tasks collect chats from workers whose occupations do not contain them. Such measures are increasingly used as proxies for AI exposure (e.g. Brynjolfsson et al. 2026, Edlich and Slok 2026, Massenkoff and McCrory 2026). The Bureau of Labor Statistics now also uses two chat-based measures in the ‘observed’ dimension of AI-exposure categories in its employment projections, while noting that these measures “do not directly observe whether workers in a particular occupation used AI on the job” (Bureau of Labor Statistics 2026). Such proxies deserve caution.
Second, chat data may be better matched to a taxonomy of basic activities (writing, coding, gathering information) than to O*NET’s occupation-specific, purpose-oriented tasks. Earlier Real-Time Population Survey waves that ask about basic activities indeed find writing to be the most common use (Bick et al. 2024).
Third, task-level data on AI use should be anchored in who the worker is, that is, their occupation and the tasks their job actually entails, and should include the workers who do not use AI. A representative survey delivers that; platform logs cannot.
Our approach has limits of its own: it covers only the ten most important tasks in each occupation and cannot resolve small occupations. Chat logs have the opposite strengths and weaknesses: they observe use at scale but not who is using it or for what purpose. The two sources are therefore complements rather than substitutes, and both would gain from a common taxonomy. Surveys can ask about the basic activities that chat classifiers recognise, and chat classification can draw on occupational context where available so that each can be checked against the other.
Source : VOXeu