Claims from macroprudential authorities about house price overvaluation, for example for Sweden, based on the house price-to-income ratio are often exaggerated. This column argues that the sustainable level of interest rates needs to be part of any calculation of house price fundamentals, but no single metric of over- or undervaluation is satisfactory. This includes the user cost-to-income ratio. Instead, structural empirical models of housing and mortgage markets are required for an evidence-based assessment.
In the period 2005-2007, house prices in a number of countries such as the US, Ireland, and Spain became seriously overvalued. Their subsequent fall contributed to the financial crisis and recession that followed. Macroprudential authorities around the world have since been focused on such overvaluations as one source of financial instability, though they typically track a comprehensive dashboard of risk factors, for example as published quarterly by the European Systemic Risk Board (ESRB). A tendency towards overvaluation would be a signal to tighten macroprudential policies such as limits on loan-to-value or debt service-to-income ratios, or higher capital requirements on lenders.
Svensson (2023) is rightly critical of reliance on the house price-to-income ratio as a measure of over-valuation, though the ESRB, for example, uses four different indicators. Instead, Svensson argues that house prices in Sweden have been, and continue to be, seriously undervalued. The gist of his argument is that housing in Sweden has become more affordable as measured by the ‘user cost-to-income’ (UCTI) ratio. He defines the user cost of a home as the product of an adjusted real mortgage interest rate and the house price. The adjustments include adjustments for tax relief on mortgage interest payments, property taxes and depreciation. As this measure has become lower in recent years with the fall in interest rates, at least to early 2022, he concludes that housing cannot be overvalued, and so the price-to-income (PTI) ratio (apparently showing such overvaluation) must, somehow, be misleading. For context, Figure 1 shows the house price-to-income ratio and the real house price index (both in logs). Svensson says: “For Sweden, the UCTI and PTI indicators are in fact strongly negatively correlated and have opposite signs. If the UCTI indicator is right, the PTI indicator is consistently wrong” (Abstract, Paragraph 3). On this basis, he argues that Swedish house prices became increasingly undervalued, reaching a peak of undervaluation of 30% in 2019. Even with recent falls in Swedish house prices and higher interest rates, he argues that house prices in 2023Q2 were still undervalued by around 20%.
Our key point is that yes, the PTI indicator is consistently wrong, but not because the UCTI indicator is right. Neither captures the fundamental drivers of house prices.
Figure 1 The house price-to-income ratio and real house prices in Sweden (2015=100)

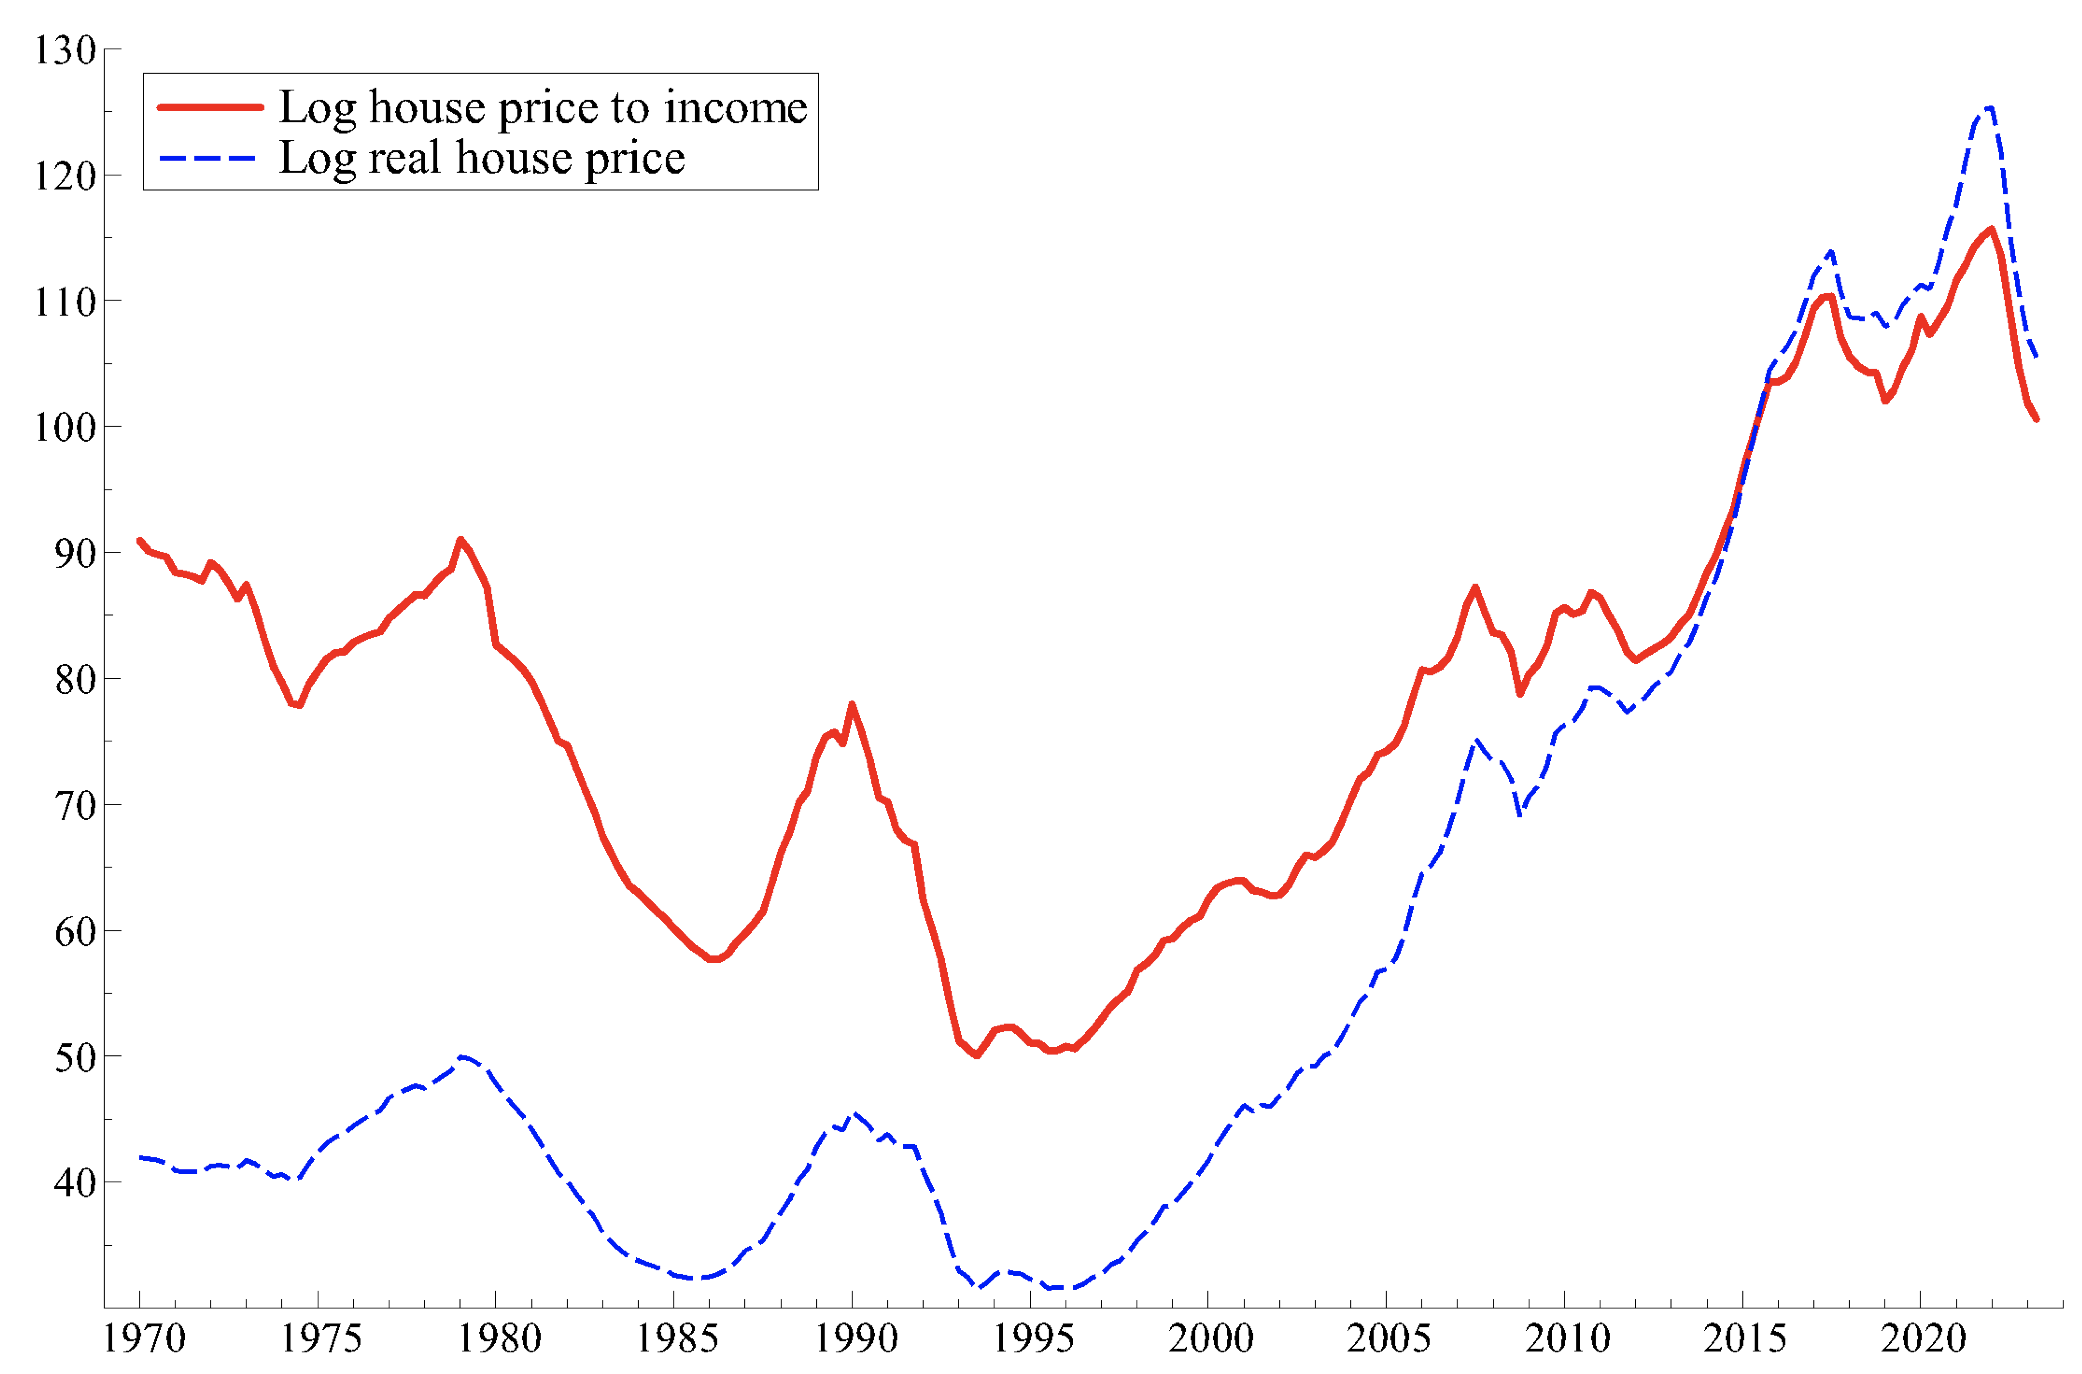
Source: OECD.
Svensson (2003: p. 12) defines the annual user cost of capital in the case of housing, as follows:
“The (annual) user cost of housing (services) can be defined as the annual cost of buying a dwelling at the beginning of a year; paying operating, maintenance, and depreciation costs, as well as taxes during the year; and selling the dwelling at the end of the year, paying any capital-gains tax at the end of the year”, and footnotes that “Annual average transactions cost associated with the purchase and sale of the dwelling over a typical ownership period can be added.”
In other words, the user cost is the product of the price of a house and its finance cost. The user cost-to-income ratio just divides this product by average per capita household income. There are a number of minor, technical issues regarding details of this definition. 1 But our main concern is that the user cost, especially if transactions and other costs are properly averaged over a typical ownership period, will strongly depend on the difference between the purchase price and the expected sales price. Svensson assumes that expected house prices adjust in line with the expected index of consumer prices, 2 so that real capital gains are always expected to be zero. Thus, he writes (p. 14), that “[u]nder the conservative assumption that the expected real after-tax capital gains are zero, the expression for the UCC simplifies …. This assumption is conservative in the sense that it is biased towards lower capital gains and higher user costs.”
To assume that house price expectations are the same as consumer price expectations makes little sense. There is a great deal of evidence for an extrapolative element in expectations of capital gains in housing, though its size differs across countries. 3 Defining user costs with such expectations results, for example, in very low user costs in the US in 2005 just at the height of the property bubble, fuelled by laxer credit standards, income growth, and lower mortgage rates. Soon afterwards, as house prices turned down, user costs rocketed upwards, exacerbating the downturn. Indeed, low housing finance costs incorporating realistic expectations are often a better indicator of overvaluation than of undervaluation! This is because they embody an important house price over-shooting mechanism: in a sustained housing market upswing, many participants are still extrapolating past appreciation when fundamentals and negative shocks have turned against the market.
The example of the US
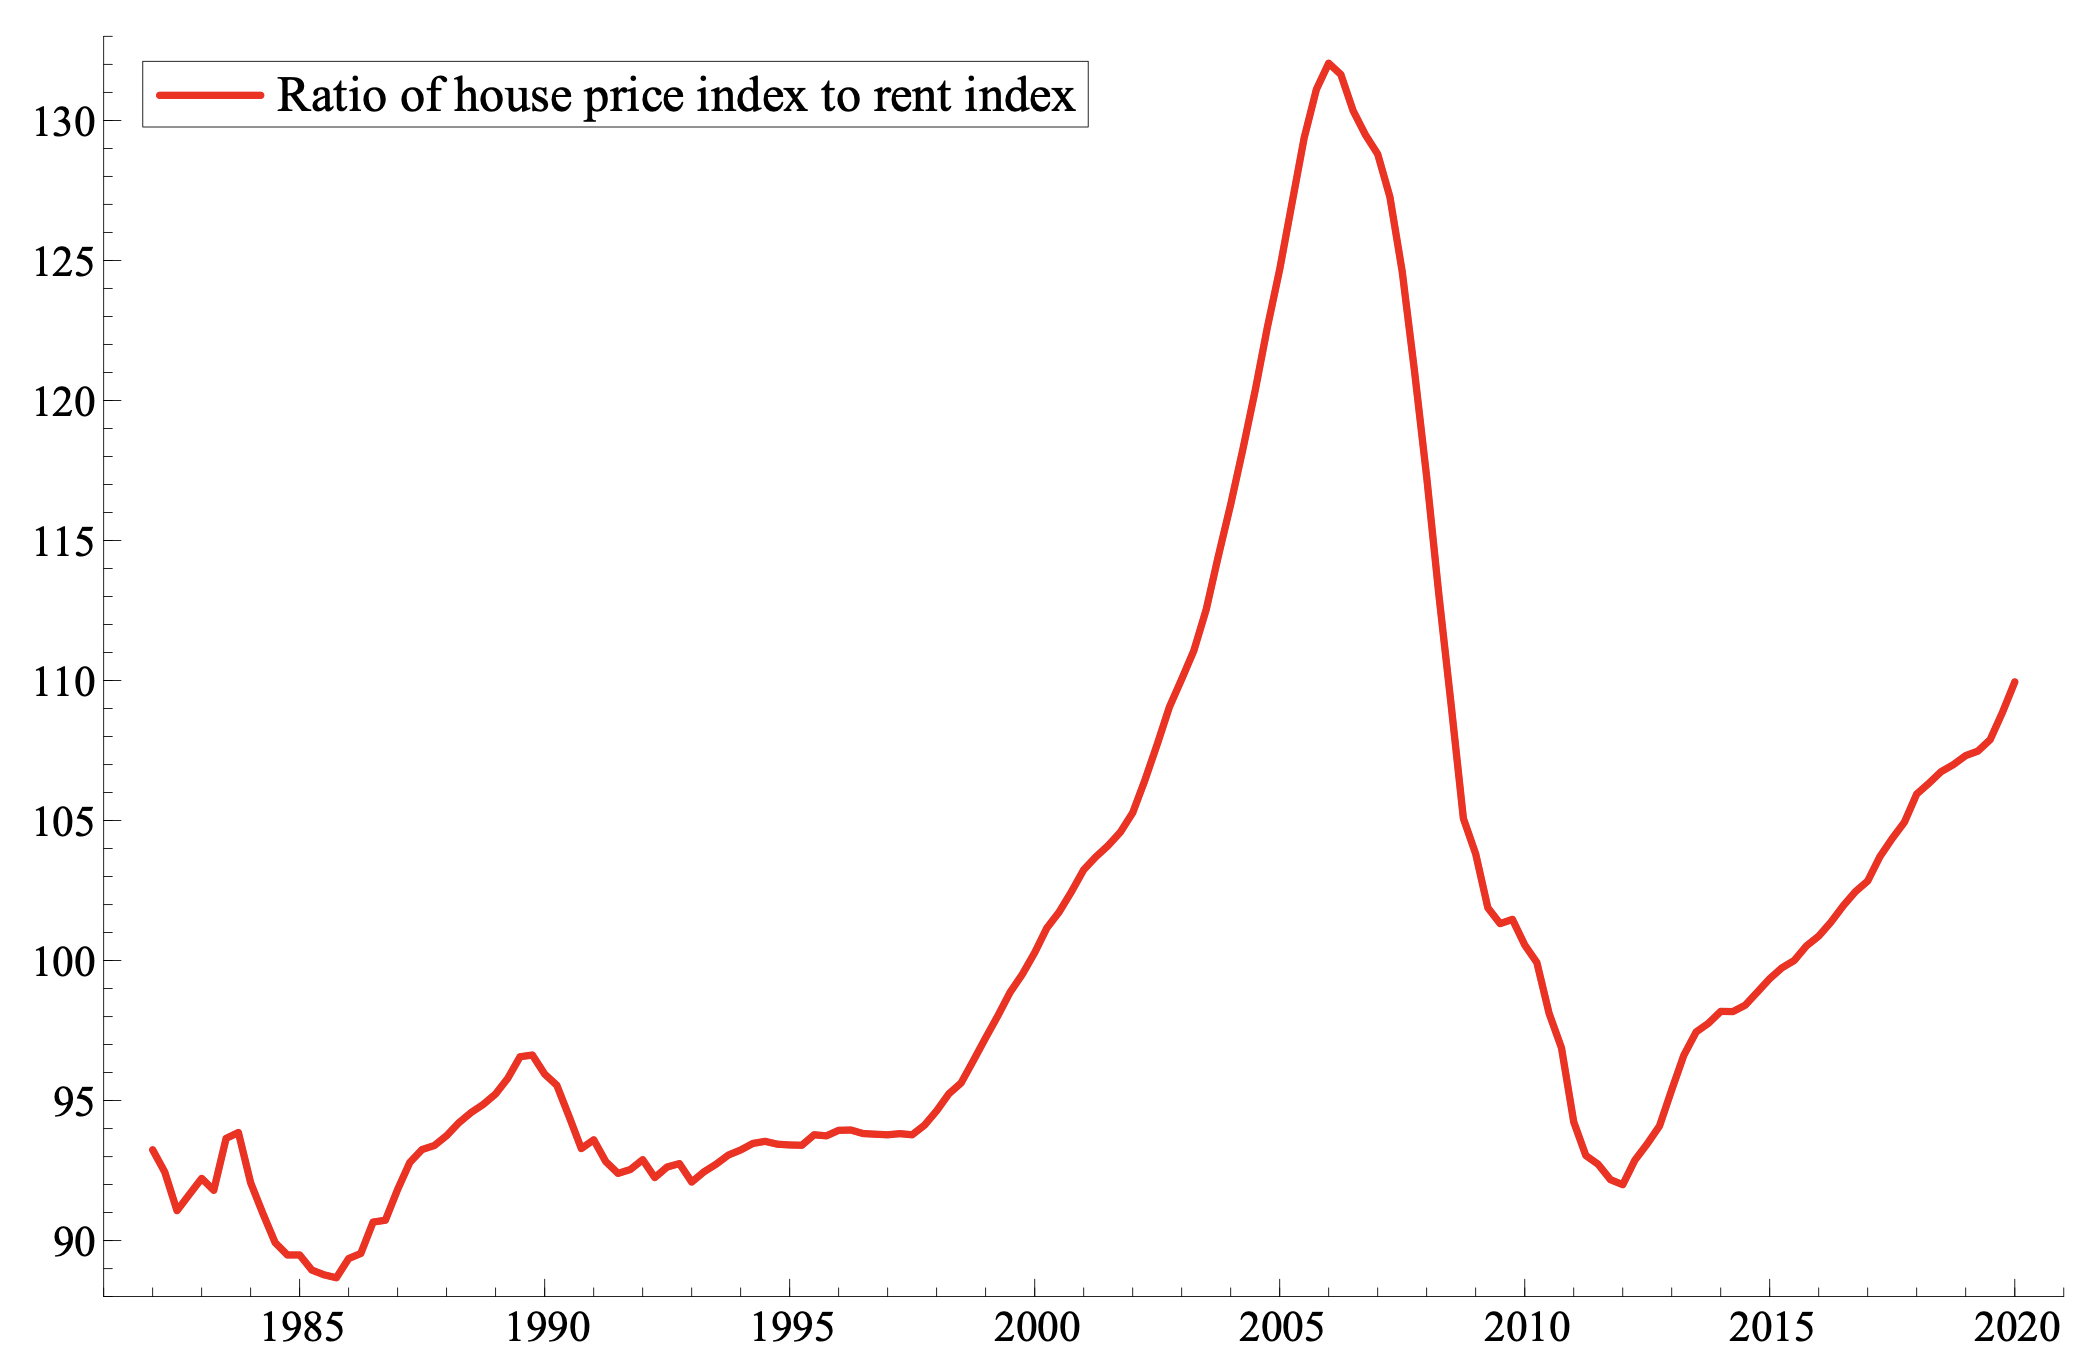
Svensson’s preferred measure of the interest rate component of user cost is the real mortgage rate defined by subtracting expected consumer price inflation from the nominal mortgage rate, adjusted for tax etc. He argues that expected consumer price inflation is a good proxy for expected house price appreciation, implying that real expected house price appreciation is zero. Figure 2 compares, for the US, the adjusted real mortgage interest rate using the expected annual inflation rate for the next five years, with the alternative that subtracts from this the average annual real house price appreciation for the previous four years. 4 Figure 3 contrasts these with a graph of the US house price-to-rent ratio. It is clear that the 2005 trough in the real mortgage rate that includes the realistic house price expectations element is strongly associated with the peak in the house price-to-rent ratio. The figure illustrates the subsequent surge in the finance element of user cost, associated with the sharp fall in the house price-to-rent ratio. The measure of the finance component of user cost preferred by Svensson shows a much more moderate decline from the mid-1990s to 2005 with little warning of the overshoot or of the subsequent correction. It then declined further while house prices continued to fall.
Figure 2 Tax-adjusted real mortgage interest rate for the US with and without expected real capital gains

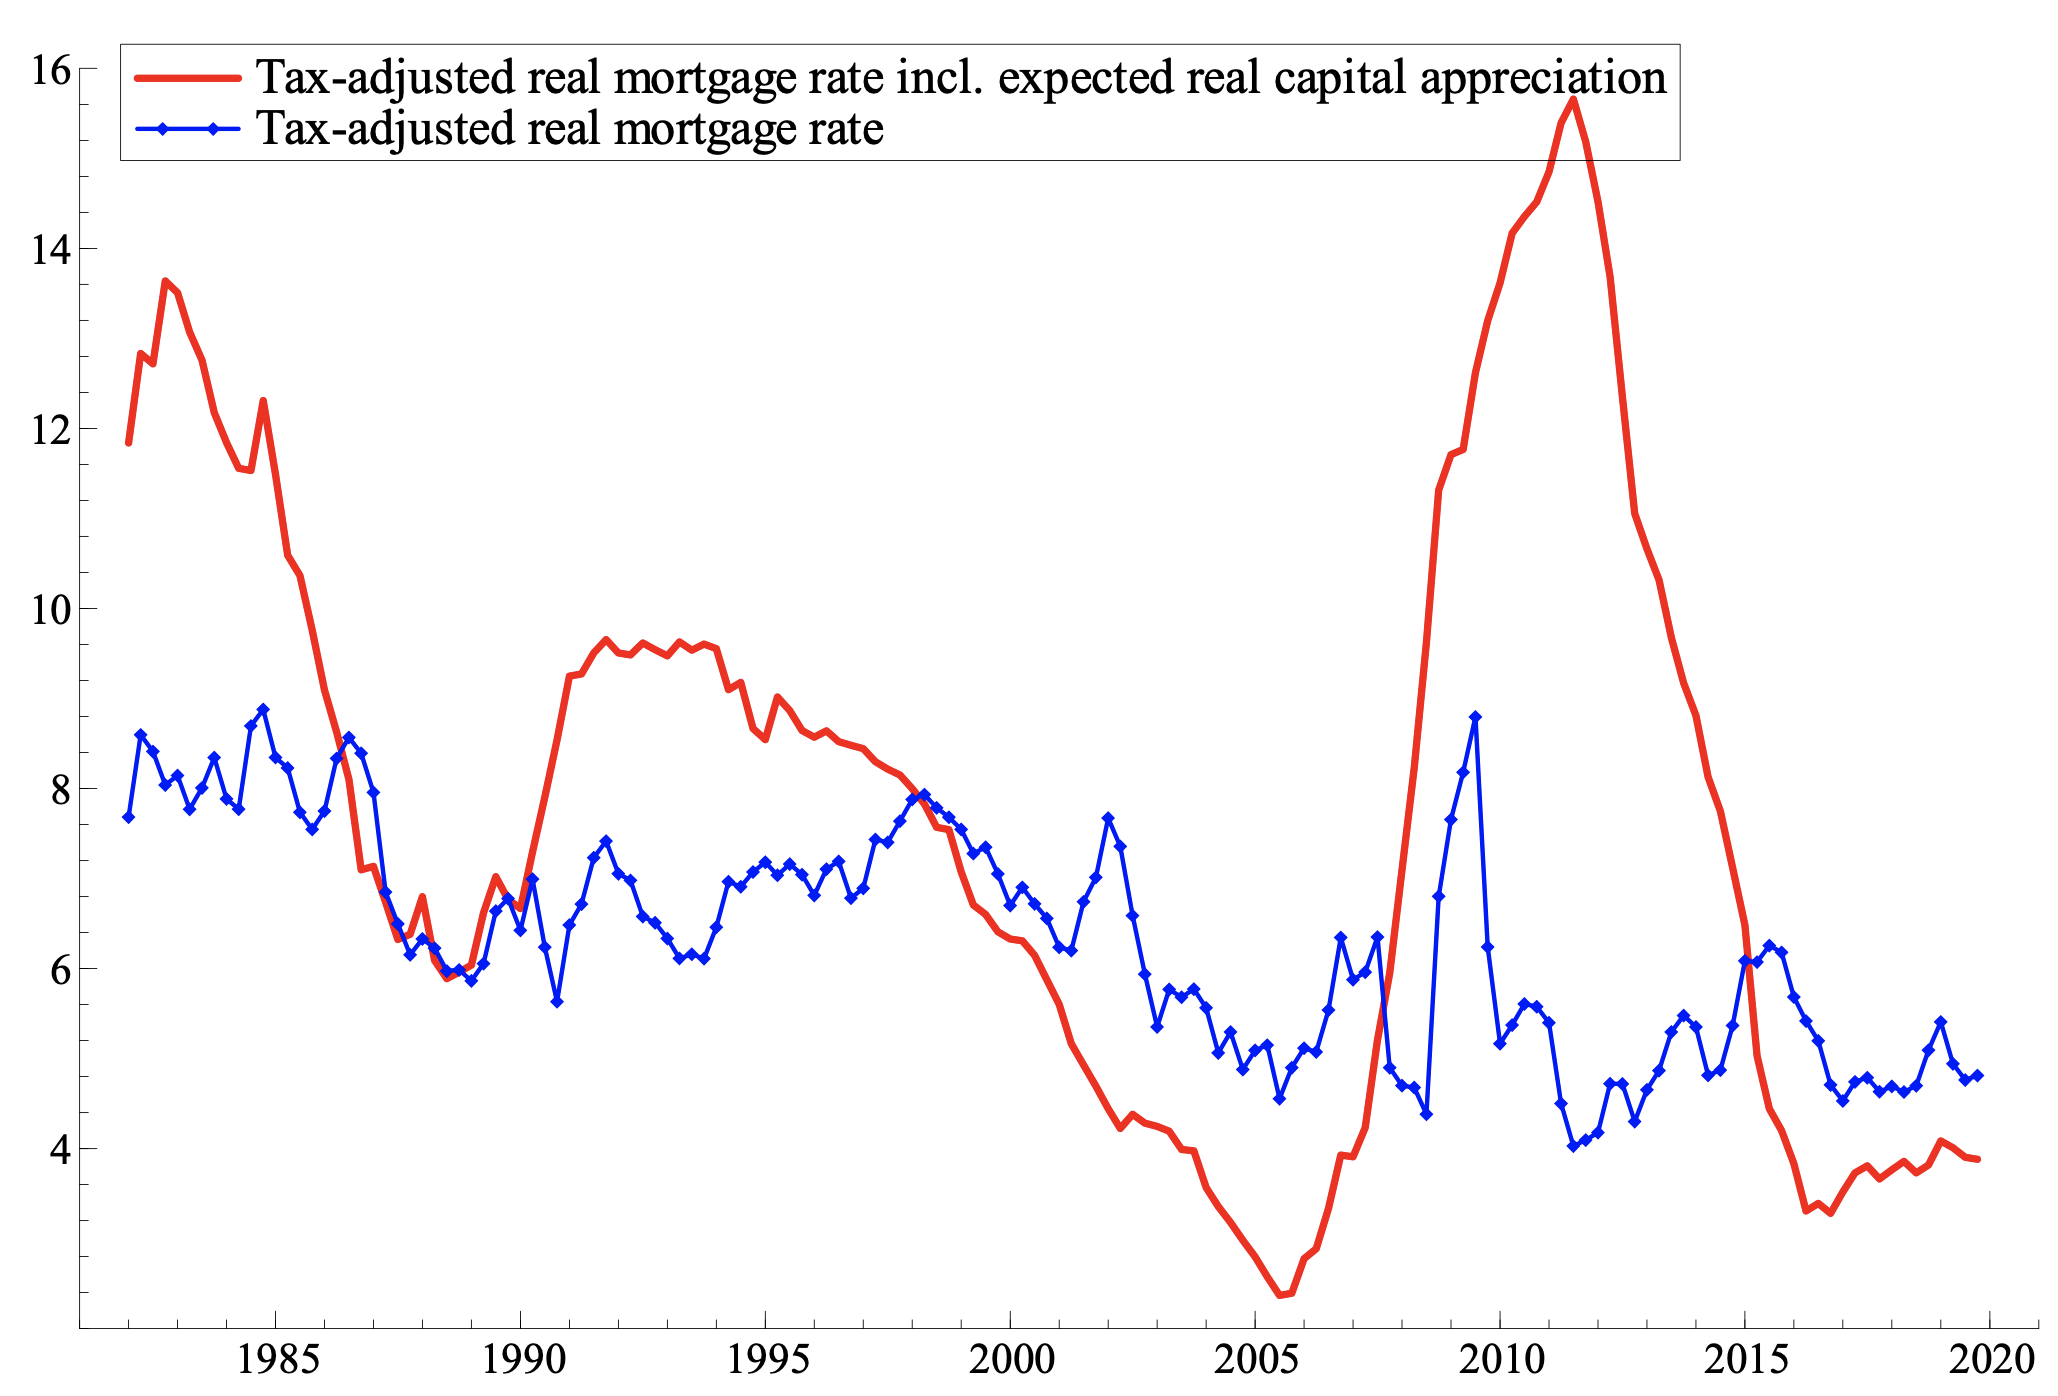
Note: See note 4 for details
Source: As in Duca et al. (2016)
Figure 3 The ratio of US house prices to rents (2015=100)

We certainly accept that Sweden is quite different from the US, with relatively stringent bank supervision and little sign of sub-prime exuberance in mortgage lending in the last 30 years. Moreover, the prudential authority has been quite cautious since the Global Financial Crisis. In 2010, it imposed a ceiling of 85% on the loan-to-value ratio for new mortgages, reducing household leverage. And in 2016 and 2018 it tightened amortisation rules, ensuring that riskier mortgage borrowers were required to repay at least a minimum amount of their loan every year. Indeed, since the early 1990s, the average real house price appreciation rate in Sweden over the previous three or four years had fairly moderate peaks under 10% per annum even in 2007 and under 8% in 2017. By the end of 2019, these rates were below 2.5%. This would be consistent with only very moderate levels of over-shooting of house prices in 2019, if expectations of housing market participants in Sweden were generated this way.
A flexible method of estimating over- or undervaluation
Most economists would accept that house prices are driven by dynamic adjustment around fundamentals, so that over and undervaluation can occur while adjustment proceeds. 5 The inverse demand framework, where a housing demand equation is inverted, given the lagged supply of housing, is the most widely accepted framework for determining house prices in the long run.
Fundamentals, in the inverse demand framework, include at least a real interest rate and income on the demand side and the lagged housing stock on the supply side. For the same reason that economists argue that permanent income should be one of the drivers of consumption, expected income growth could well be relevant too. And in the context of adjustable mortgage rates, as in Sweden, Kearl (1979) argued for the relevance of the nominal mortgage rate. However, shifting loan standards are often omitted from demand drivers. Be that as it may, it is obvious that the user cost-to-income ratio, however defined, is not the sole fundamental driving house prices. It cannot, therefore, be the sole arbiter of where to position the estimate of the fundamental long-term level of real house prices.
Various papers (e.g. Duca et al. 2016) embedded past appreciation in user cost, tested for the most relevant memory length and included controls for loan standards. In Chauvin and Muellbauer (2018), loan standards are picked up as a latent variable in a system of equations and found to greatly improve forecasts of NPL ratios one and two years ahead.
Many other researchers do not embed lagged house price appreciation in user cost (e.g. Anundsen 2021) and instead follow the category of models discussed by Abraham and Hendershott (1996). A simple partial adjustment model implies, given lagged adjustment, overvaluation when fundamentals worsen and the opposite for undervaluation. Abraham and Hendershott (1996) make the crucial observation that with lagged changes in house prices in the model, one can have overshooting after a series of positive shocks, pushing prices above fundamentals – the ‘bubble builder’. When the fundamentals worsen, one can get a ‘bubble burster’, as the correction of the previous overvaluation gathers speed with falls in house prices adding to downward momentum. The empirical questions then concern the specification of the fundamentals and the specification and estimation of the lagged house price growth effects. An important conclusion about econometric models for evidence on potential overvaluation drawn in Muellbauer (2022: 207) is to model jointly house prices and mortgage debt to extract shifts in loan standards common to both.
Swedish house prices could have been undervalued in 2019 if the empirical model finds small effects from past appreciation and if recent shifts in fundamentals were positive. A simple, indeed simple-minded, way of judging ex post whether real house prices were overvalued at time t is to see whether they fell afterwards. Unfortunately for this simple test, the COVID pandemic arrived early in 2020 and, as Svensson argues, shifted preferences: many people began to work at home, increasing the demand for space and driving up the equilibrium level of real house price indices, in which land prices are the major determinant. Post-COVID, it seems that some of the shift in preferences was permanent.
An equally simple-minded test of whether house prices were under- or overvalued at the end of 2021, once the COVID crisis had largely been contained by vaccination, is to examine what happened next. Of course, we now know that real house prices is Sweden have since fallen by around 15% (see Figure 1). This should be no surprise given the rise in nominal interest rates and the impact of high inflation, mainly induced by Russia’s invasion of Ukraine, on real incomes. It does make rather surprising Svensson’s claim that real house prices are still undervalued by around 20%. The claim would need a story about the fundamental level of nominal interest rates returning to end-2021 levels and a strong recovery of income, together with some assumptions about a further long-term impact on house prices of changed working from home patterns. While not impossible, it seems to us quite improbable.
Conclusion
In this column we emphasise that a key to both user cost and the price of any long-lived asset are expectations about the future trend of the expected price of that asset. To complement and check on econometric estimates of such expectations, whatever methodology is followed, it is advisable to undertake regular surveys of such expectations (see Shiller and Thompson 2022, who confirm that house price expectations in the US in the 2000-2005 period were remarkably optimistic).
The negative relationship between current house prices and their user cost embedding expectations of future price trends, (i.e. the positive relationship between affordability and current prices) is not because one is misleading and the other correct. They are simply two sides of the same coin.
Source : VOXeu


")


")


.jpeg")


")


")


")


")
")

")