



With public debt at high peacetime levels, how advanced economies can reduce debt burdens is again at the centre of policy debate. This column examines the role of financial repression, perhaps the least studied channel, by applying new quantity-based measures to more than a century of data for 17 advanced economies. The findings show that repression has been a persistent feature of modern policymaking, playing an important role in post-World War II debt reduction and rising again since the Global Financial Crisis. With several of the conditions historically associated with repression present today, its use may increase going forward.
How governments bring down heavy debt burdens is a longstanding question in public finance, one that has acquired renewed urgency as advanced-economy debt ratios have reached historically high peacetime levels.
Standard approaches to restoring fiscal space, such as fiscal consolidation and growth-enhancing reforms, remain central, yet they can be slow to deliver and politically difficult to sustain, particularly in a fragmented political environment (Gaspar et al. 2017, Furceri et al. 2024). Surprise inflation and debt monetisation have also received considerable attention (e.g. Marion and Aizenman 2009, Raviv et al. 2014, Pisani-Ferry and Blanchard 2020). Recent work by Eichengreen and Esteves (2022), for example, shows that inflation helped most when at low and stable levels, whereas high inflation often led interest payments to rise and offset much of the benefit.
And then there is financial repression, widely thought to have mattered historically but perhaps the least systematically studied channel of all.
The concept of financial repression dates back to McKinnon (1973) and Shaw (1973), who used the term to describe policies that constrain financial intermediation and implicitly tax savings. Subsequent work has narrowed the concept to policies that lower governments’ effective domestic borrowing costs. Yet repression remains difficult to measure and consequently hard to evaluate as a driver of macroeconomic outcomes.
This reflects two distinct challenges. First, historical data on who holds public liabilities are scarce and hard to compare across countries. Second, the interest rate that would have prevailed without captive demand is inherently unobserved. Existing studies have therefore relied either on assumed counterfactual rates (Reinhart and Sbrancia 2015) or on detailed country-specific evidence (Acalin and Ball 2023, Lehner et al. 2025).
In our recent paper (Bolhuis et al. 2026), we tackle both problems. First, we assemble comparable data on the liabilities of governments and central banks, and on their sectoral holders, for 17 advanced economies since 1920. Second, we develop a new theoretical framework that exploits differences between commercial banks’ and households’ portfolio behaviour to identify policy-induced captive demand and recover the interest rates that would have prevailed without it. This allows us to estimate the resulting fiscal savings and separate the contribution of repression to debt dynamics from other drivers.
A portfolio-based measure of repression
Our framework starts from a simple asymmetry between regulated and unregulated investors. Commercial banks are directly exposed to policies that can steer their portfolios toward public liabilities, while households are not subject to the same requirements. Household portfolios therefore provide a benchmark for demand driven by relative returns. When banks hold more public liabilities than relative returns and household behaviour would predict, the model identifies the excess as policy-induced captive demand.
The framework yields two complementary quantity-based indicators of repression. A narrow fiscal measure captures the excess absorption of government bonds by banks. A consolidated measure expands the public-sector perimeter to include central bank liabilities and therefore captures repression operating through both fiscal and monetary balance sheets.
It is important to note that policies associated with repression may serve legitimate prudential, operational, or monetary policy objectives. Our measures therefore do not infer policy intent but focus on whether the resulting balance-sheet allocation induces regulated intermediaries to absorb public liabilities on terms that would not prevail under market-based portfolio choice.
A century of financial repression
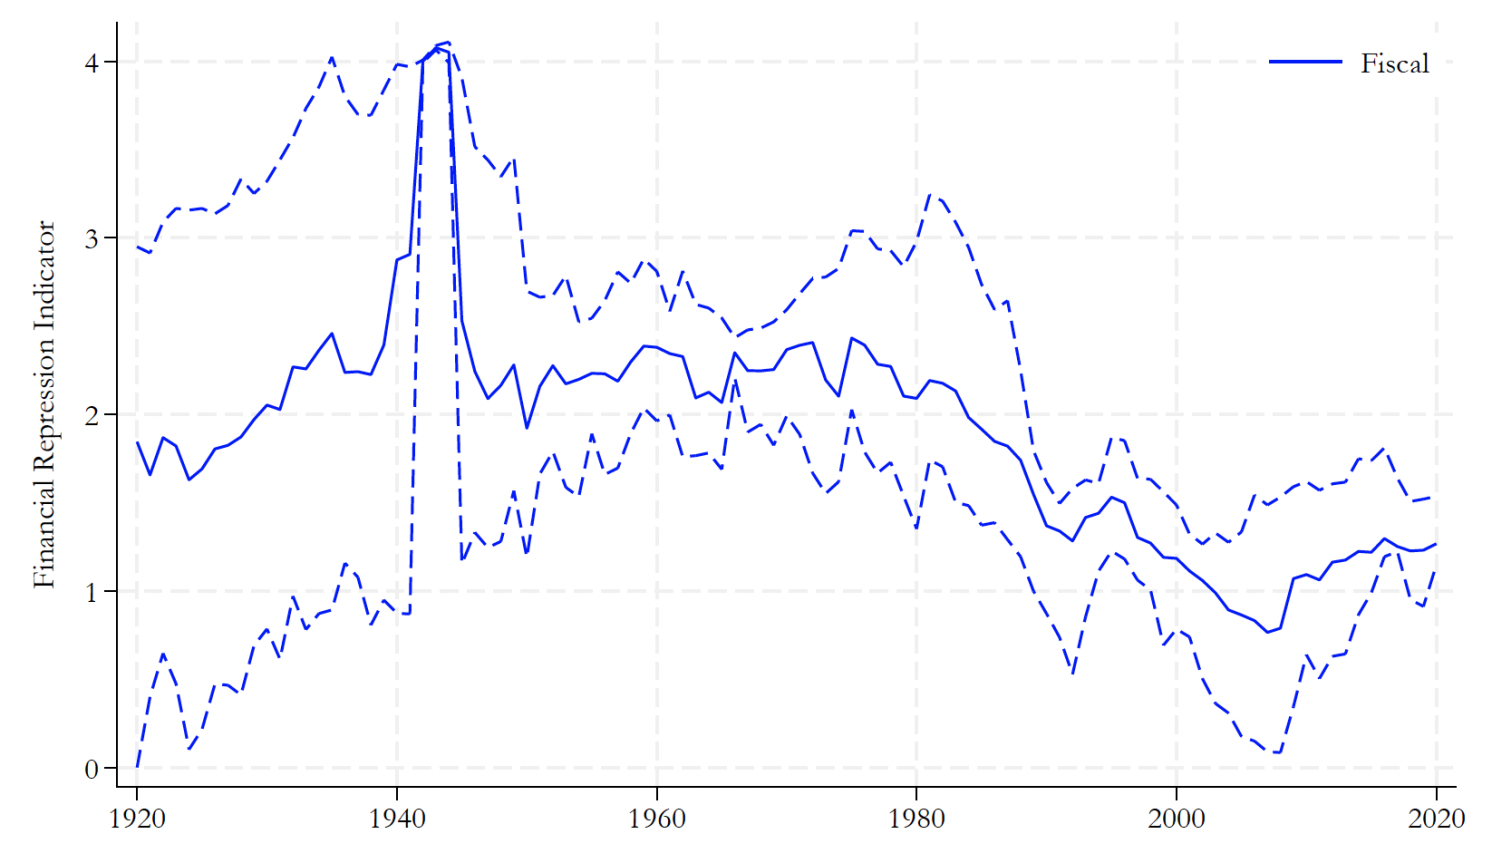
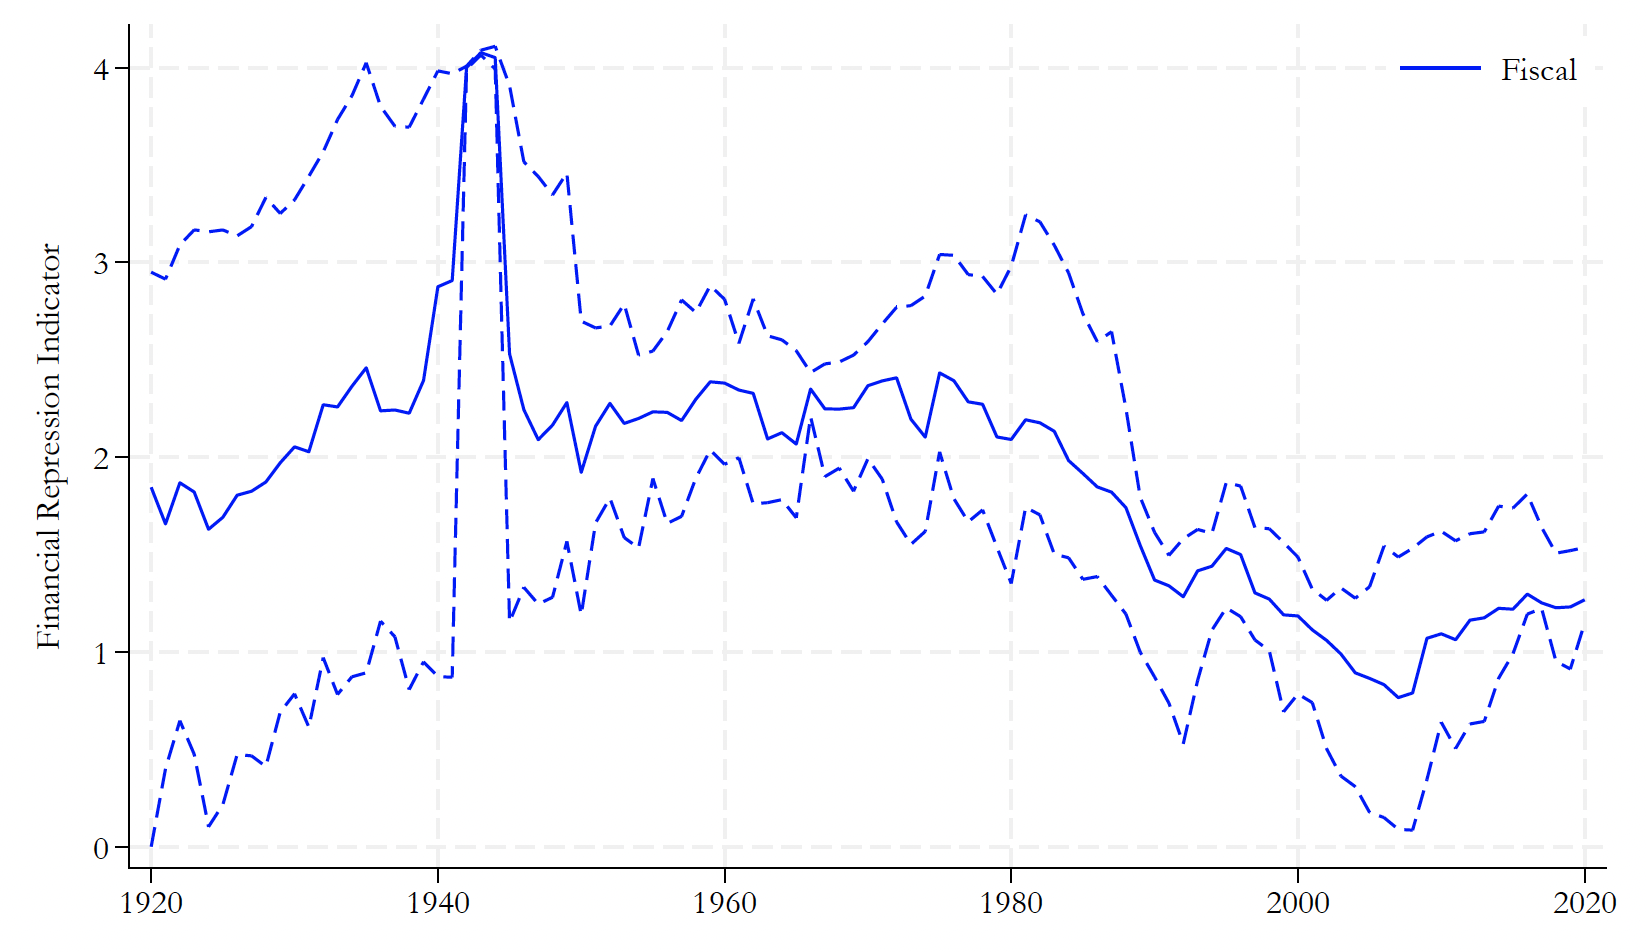
Taking our measures to over 100 years of data across 17 advanced economies, we show that repression has been a persistent feature of modern policymaking (Figure 1). Repression rose during the interwar period and peaked around World War II, amid wartime financing needs and heightened state intervention. It remained elevated through the Bretton Woods era before receding during the subsequent period of capital account liberalisation. Since the Global Financial Crisis, however, both measures have risen again. The sharper increase in the consolidated measure points to a potentially growing role for monetary repression in the recent period.
Figure 1 The use of financial repression over time
a) Time series: Fiscal repression
b) Time series: Fiscal and monetary repression
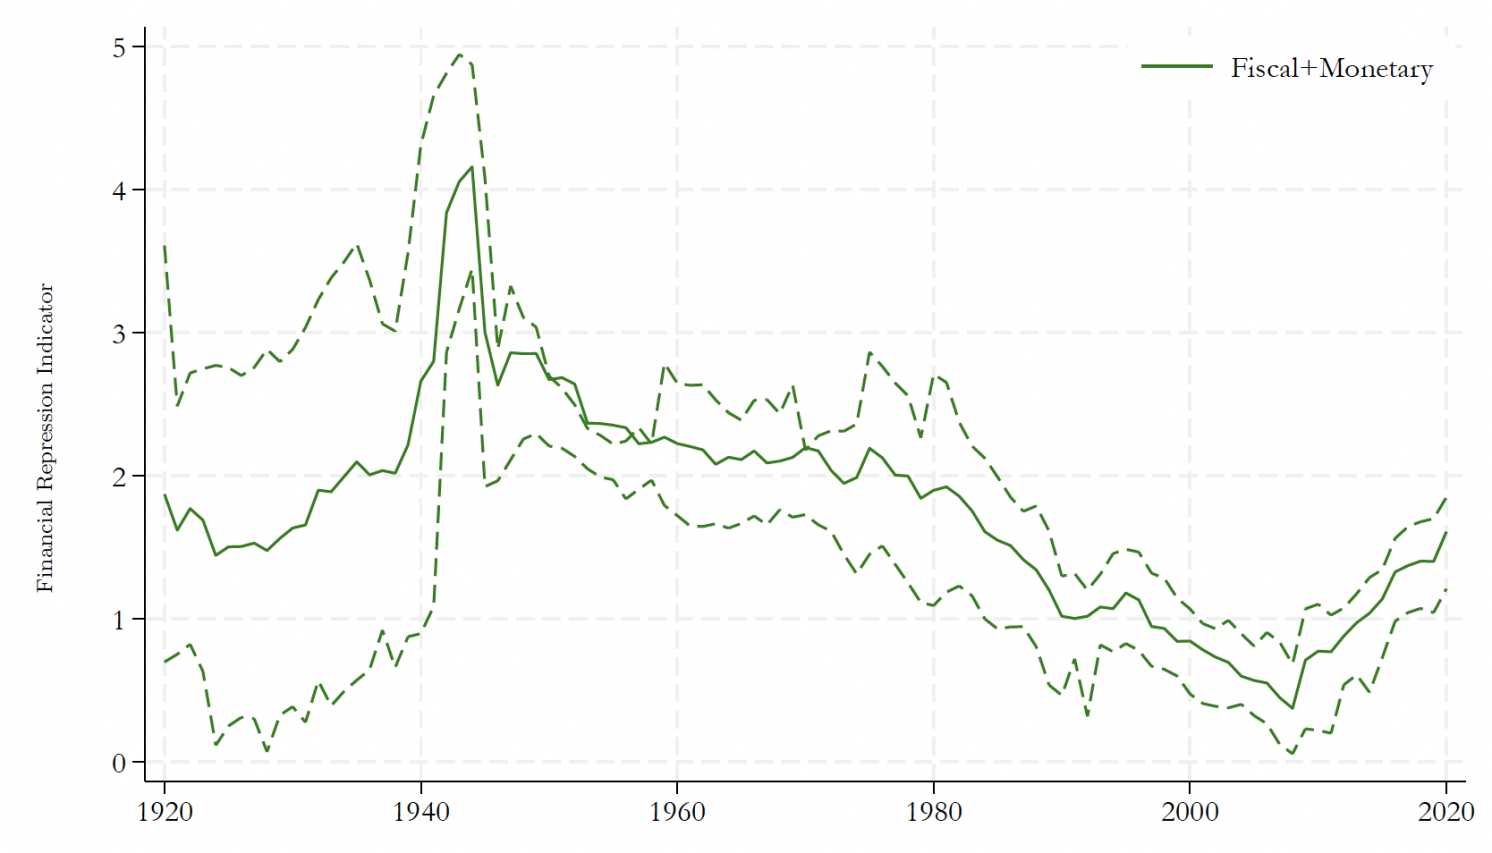
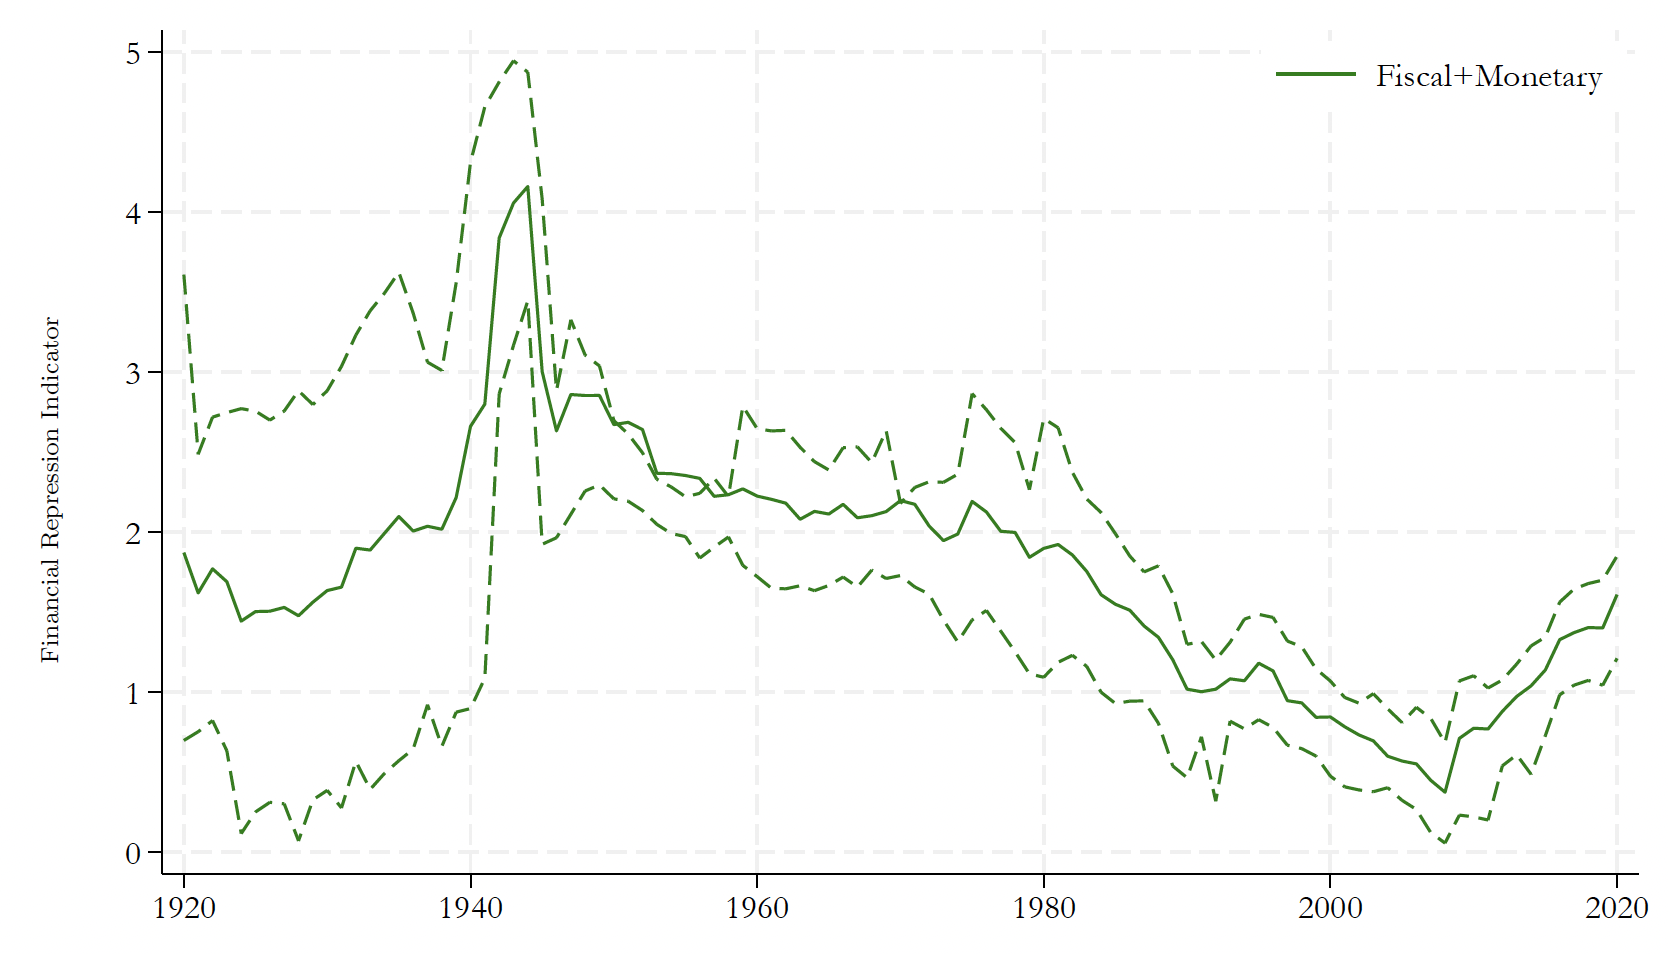
Notes: Measures are normalised relative to the minimum value for each country. Solid lines denote the mean across countries and dashed lines the 25th and 75th percentiles.
Source: Bolhuis et al. (2026).
Correlates of financial repression
To assess whether our measures capture meaningful variation in financial repression, we compare them with macroeconomic conditions typically associated with repression and direct evidence on the policies used to implement it. The indicators are higher when public debt and interest expenditures are elevated and when primary balances are stronger, consistent with governments turning to repression when fiscal adjustment is already substantial (Figure 2). They also coincide with slower private-credit growth, lower loan-to-deposit ratios, and weaker investment, consistent with some crowding out of private capital.
Figure 2 Correlates of financial repression
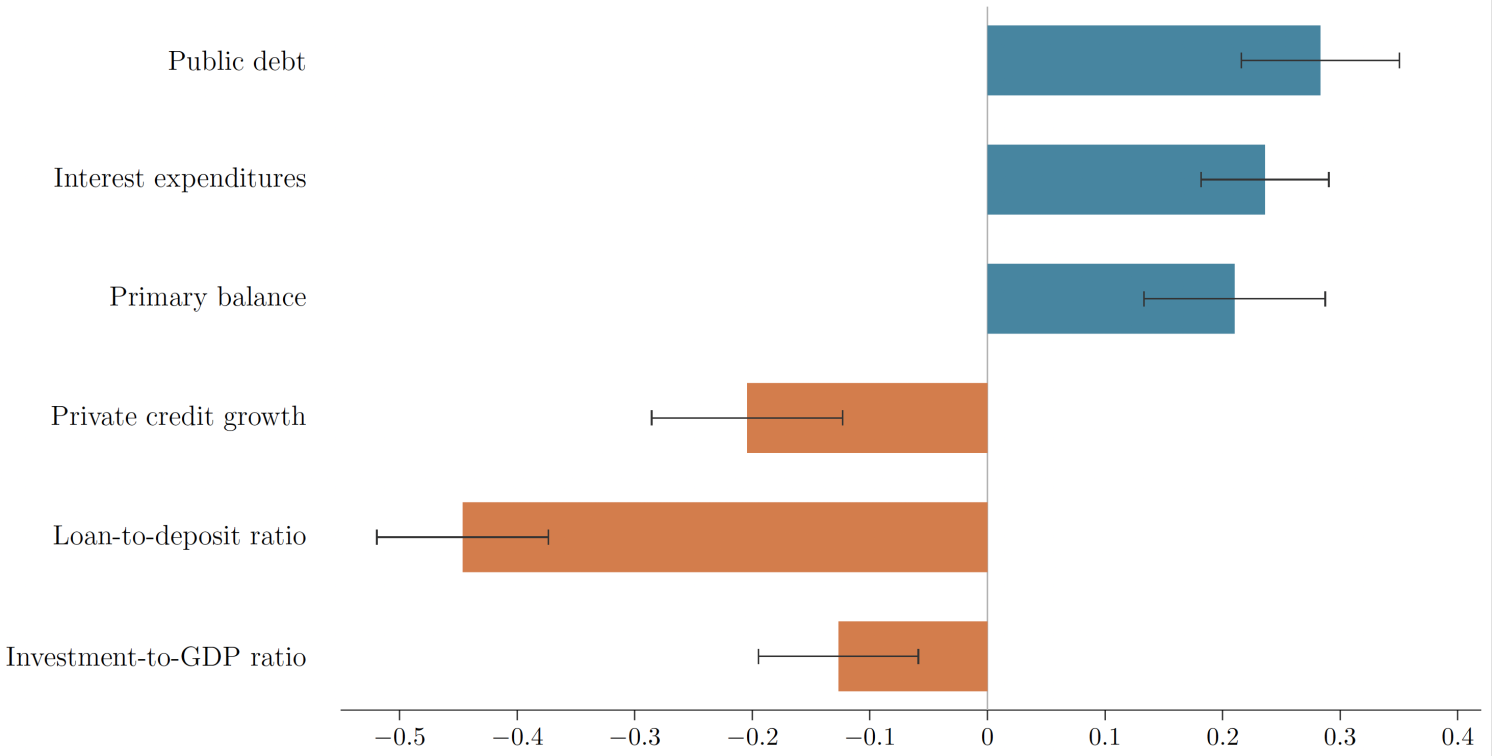
Note: Figure plots estimated coefficients from panel regressions of our fiscal repression indicator on the relevant macro-financial variables, controlling for country and year fixed effects, with 90 percent confidence intervals.
Source: Bolhuis et al. (2026).
The indicators also line up with independently collected postwar data on reserve and portfolio requirements in France, Germany, Japan, and the US. The monetary measure rises with reserve requirements, while the consolidated measure rises with the combined share of bank assets subject to reserve and government-bond portfolio requirements.
Recovering counterfactual borrowing costs
Crucially, our framework also allows us to map the measured repression indicators into their effects on sovereign borrowing costs. Using the government bond market-clearing condition, we solve for the counterfactual yield required to absorb the outstanding supply of bonds after removing the policy-induced shift in bank demand. The difference between this counterfactual market rate and the observed yield is the repression wedge.
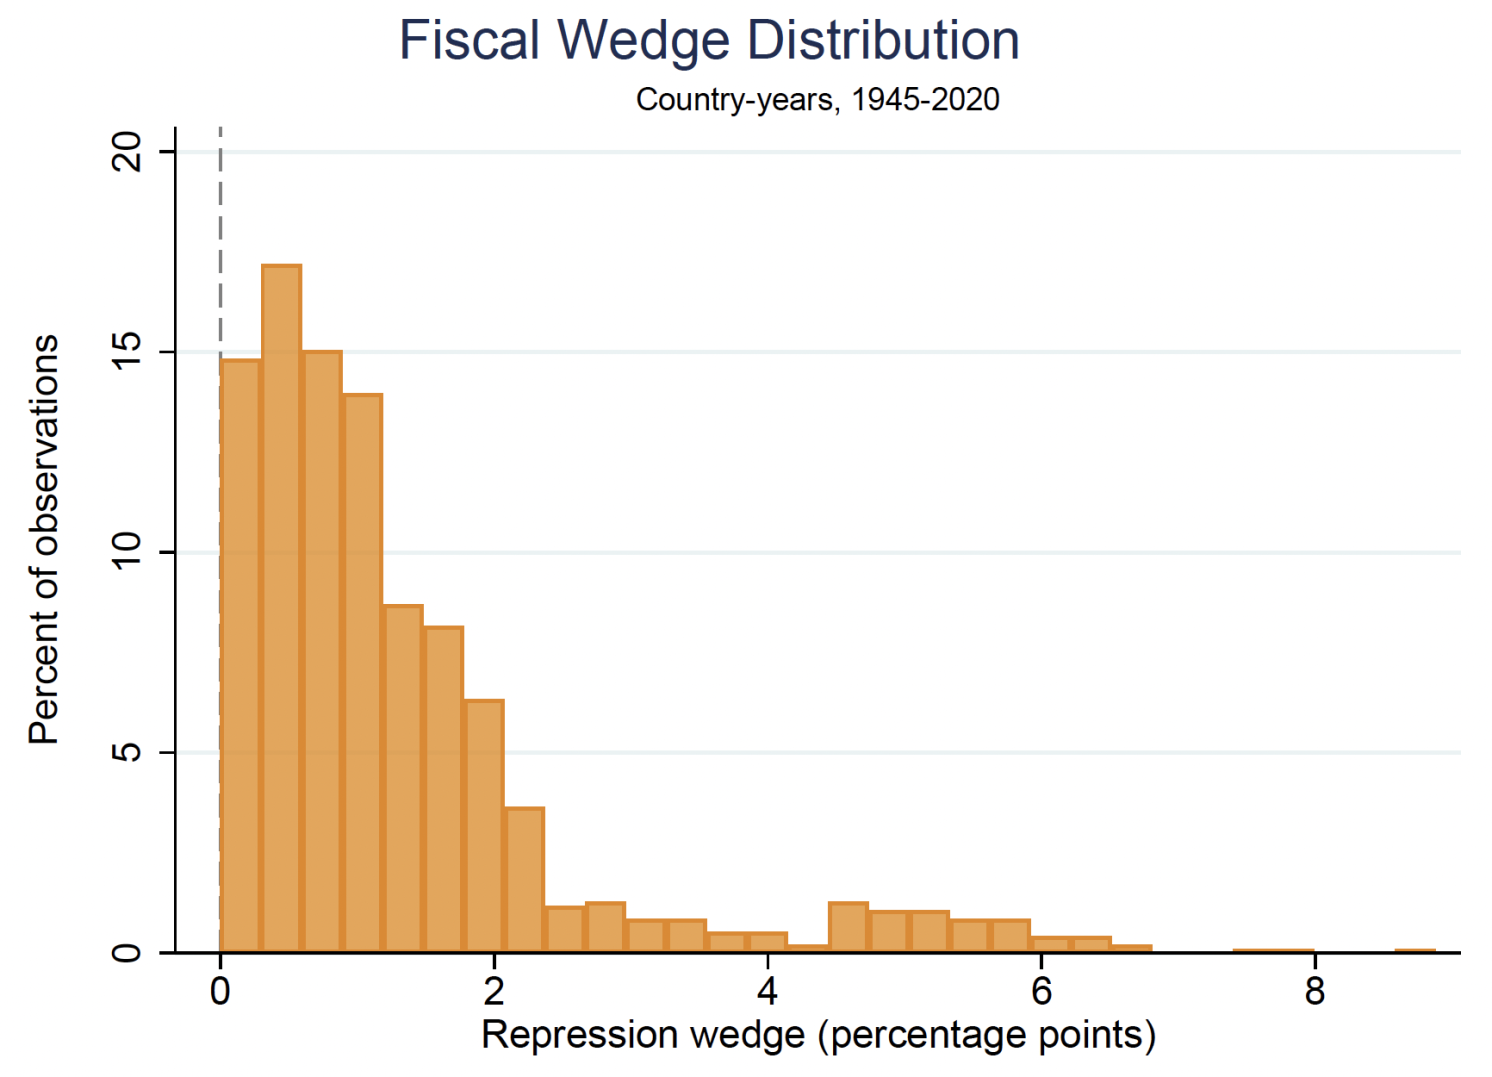
Our estimates of the repression wedge imply that financial repression has historically lowered sovereign borrowing costs materially (Figure 3). The median fiscal wedge is 0.96 percentage points, while the median consolidated wedge, which captures both fiscal and monetary repression, is larger at 1.32 percentage points.
Figure 3 Distribution of financial repression wedges
a) Fiscal wedge
b) Consolidated wedge
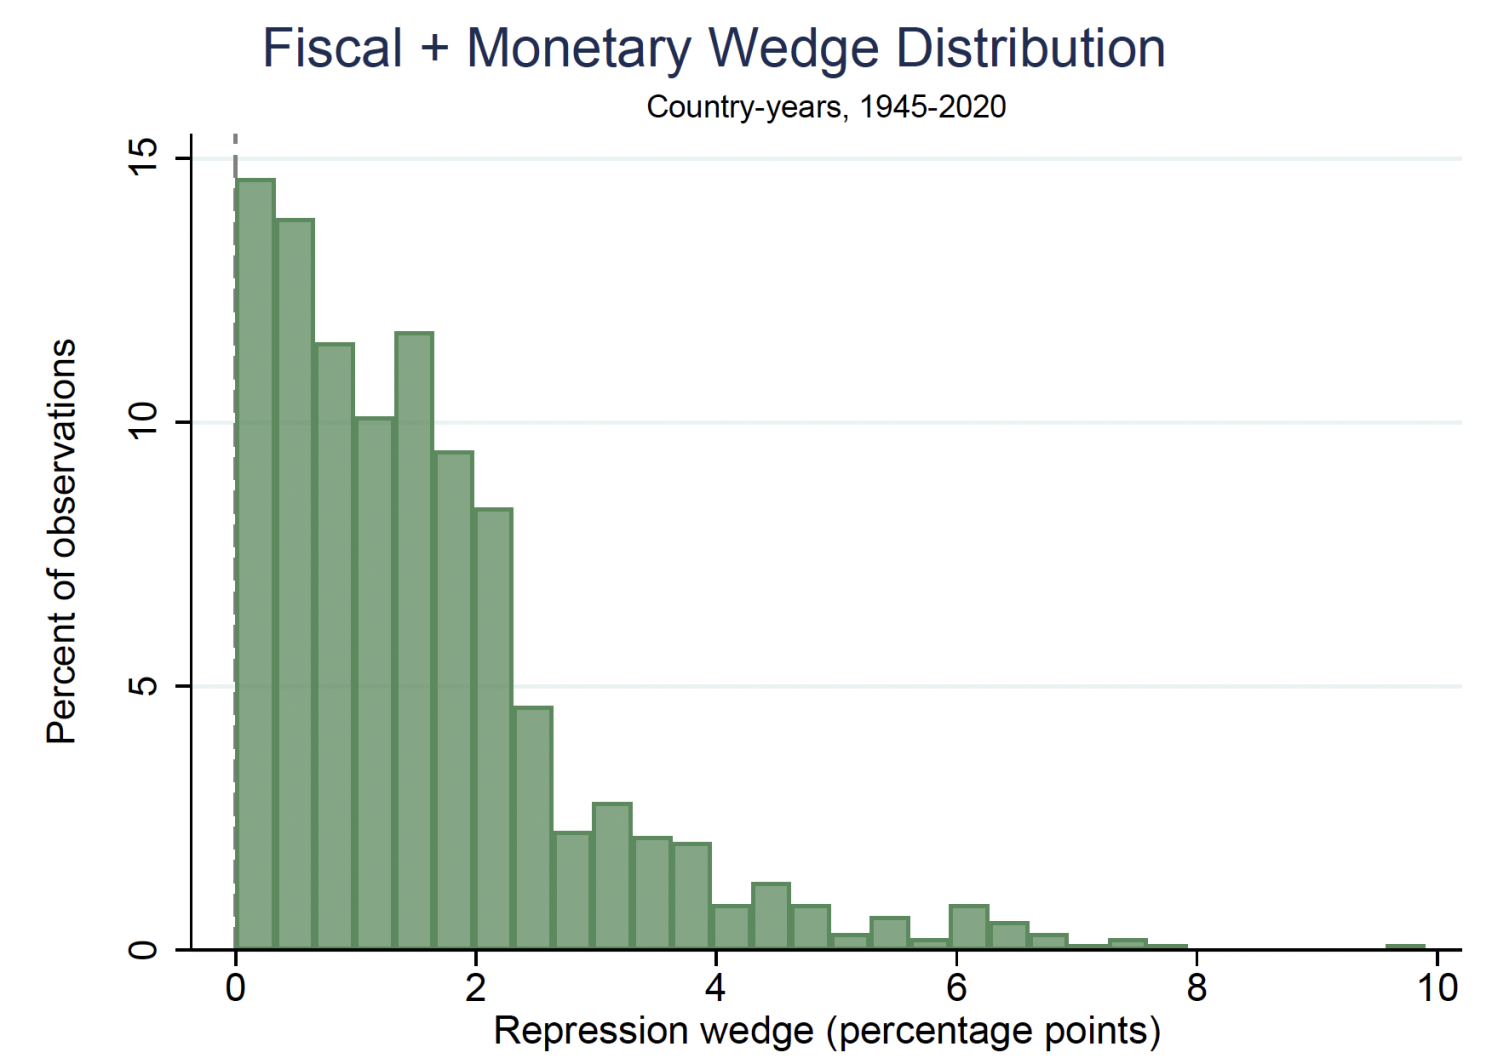
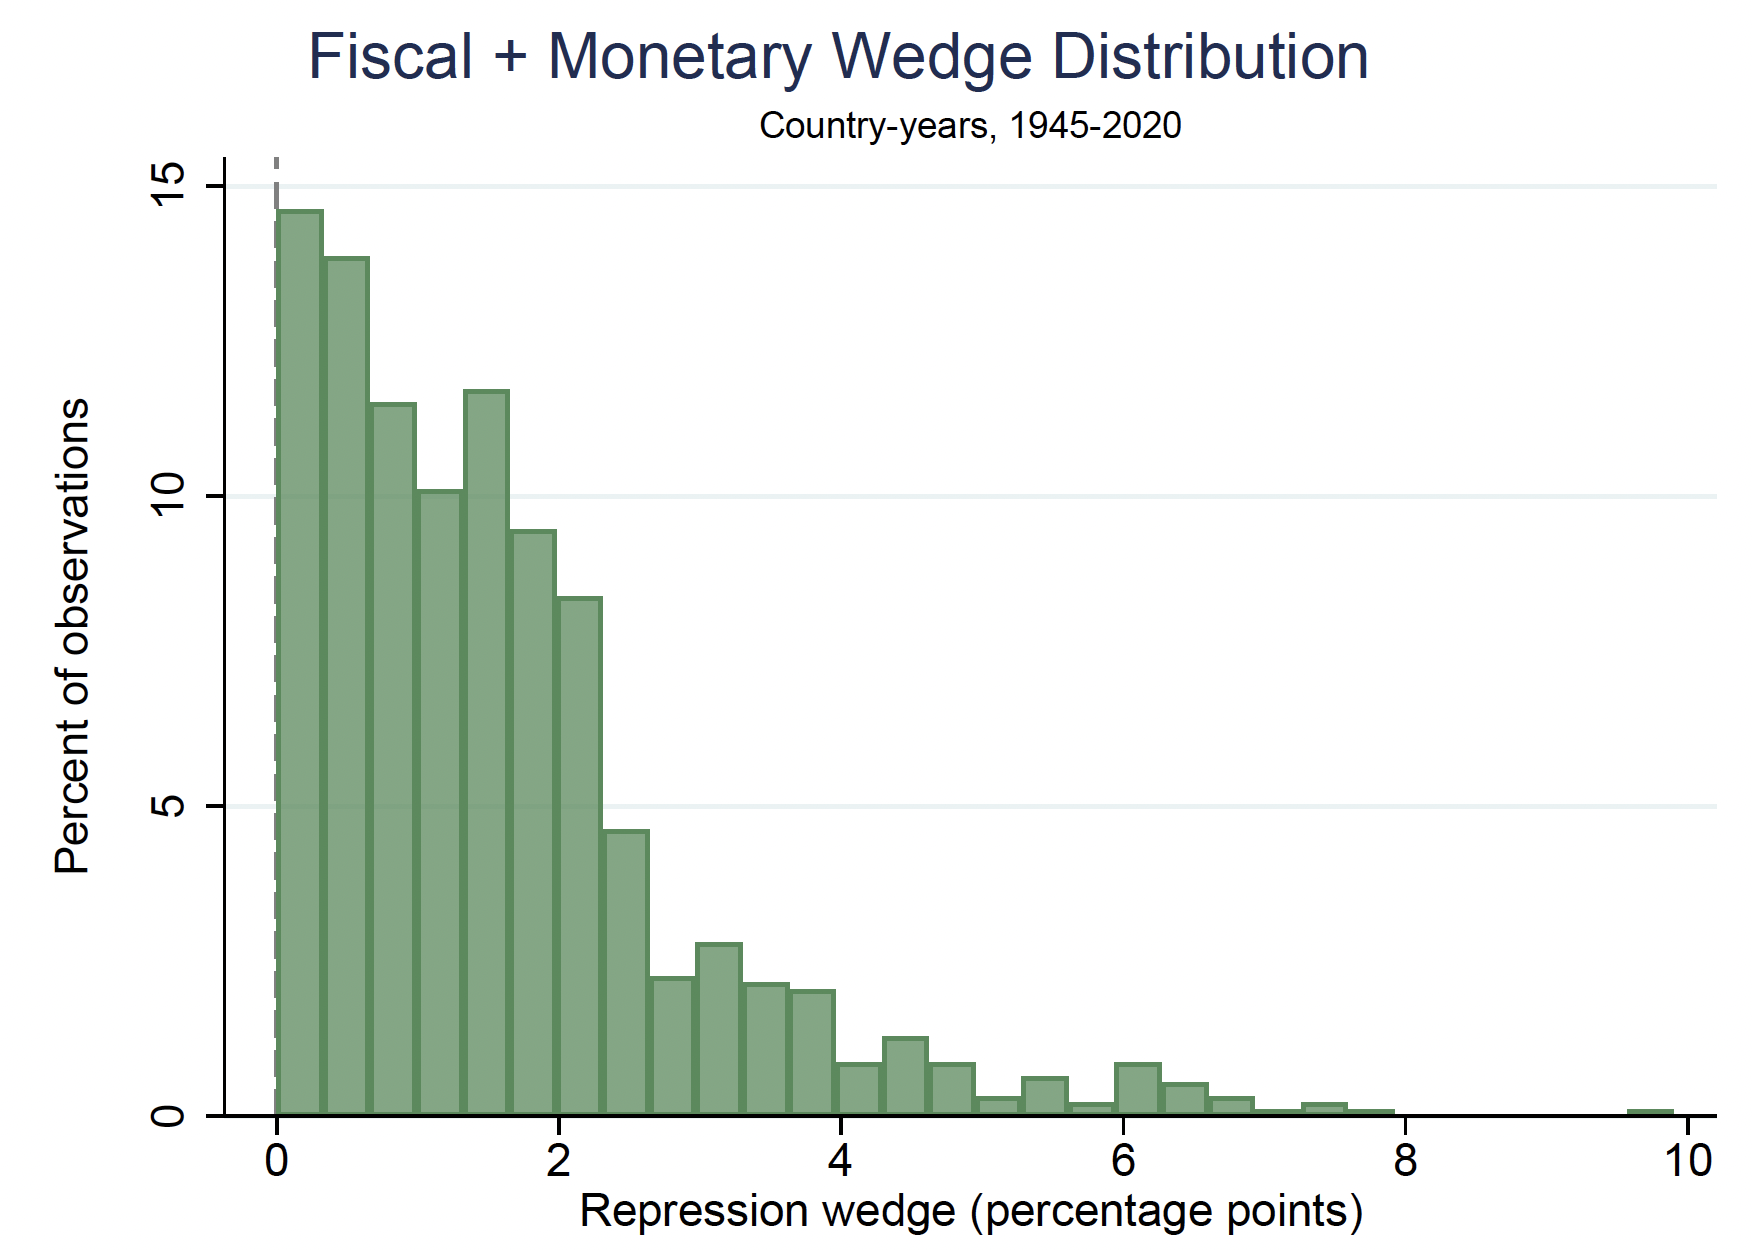
Note: Histograms show the distribution of model-implied repression wedges across country-year observations from 1945 to 2020.
Source: Bolhuis et al. (2026).
How much did repression reduce public debt?
Finally, we embed the estimated repression wedges in a standard debt-decomposition framework, allowing us to quantify the contribution of financial repression to changes in public debt. The results point to sizeable fiscal savings, although the importance of repression varied markedly across countries and episodes.
The postwar UK provides the starkest example. Financial repression was the single largest debt-reduction channel between 1945 and 1955, contributing about 91 percentage points of GDP, far more than either surprise inflation or the primary balance (Table 1). This contribution was even larger than the roughly 75 percentage point decline in publicly held debt itself, because the counterfactual real interest–growth differential was pushing debt in the opposite direction. Repression therefore did not merely accompany the decline in debt. It more than offset the adverse debt dynamics operating through market borrowing costs.
Financial repression also played a notable role in the United States, albeit to a lesser degree. Of the 46 percentage point decline in publicly held debt during the same period, repression contributed 17.5 percentage points, behind the primary balance but slightly ahead of surprise inflation.
Looking beyond these episodes, the full panel reveals that repression played an economically meaningful role in debt reduction over the past 100 years. Across the full sample period, the cross-country median of annual fiscal savings averaged around 0.57% of GDP (Figure 4). They rose sharply around WWII and peaked in the mid-1940s, with wide across-country variation during the 1940s and early 1950s. Median savings subsequently declined during the capital account liberalisation era but rose again after the Global Financial Crisis, from around 0.08% of GDP in 2008 to 0.51% in 2020.
Table 1 Contributions to changes in publicly held debt, selected episodes


Note: All entries represent cumulative contributions over the episode, expressed in percentage points of GDP and reported as debt-reducing contributions (positive values denote debt reduction).
Source: Bolhuis et al. (2026).
Figure 4 Fiscal savings from financial repression, median and interquartile range
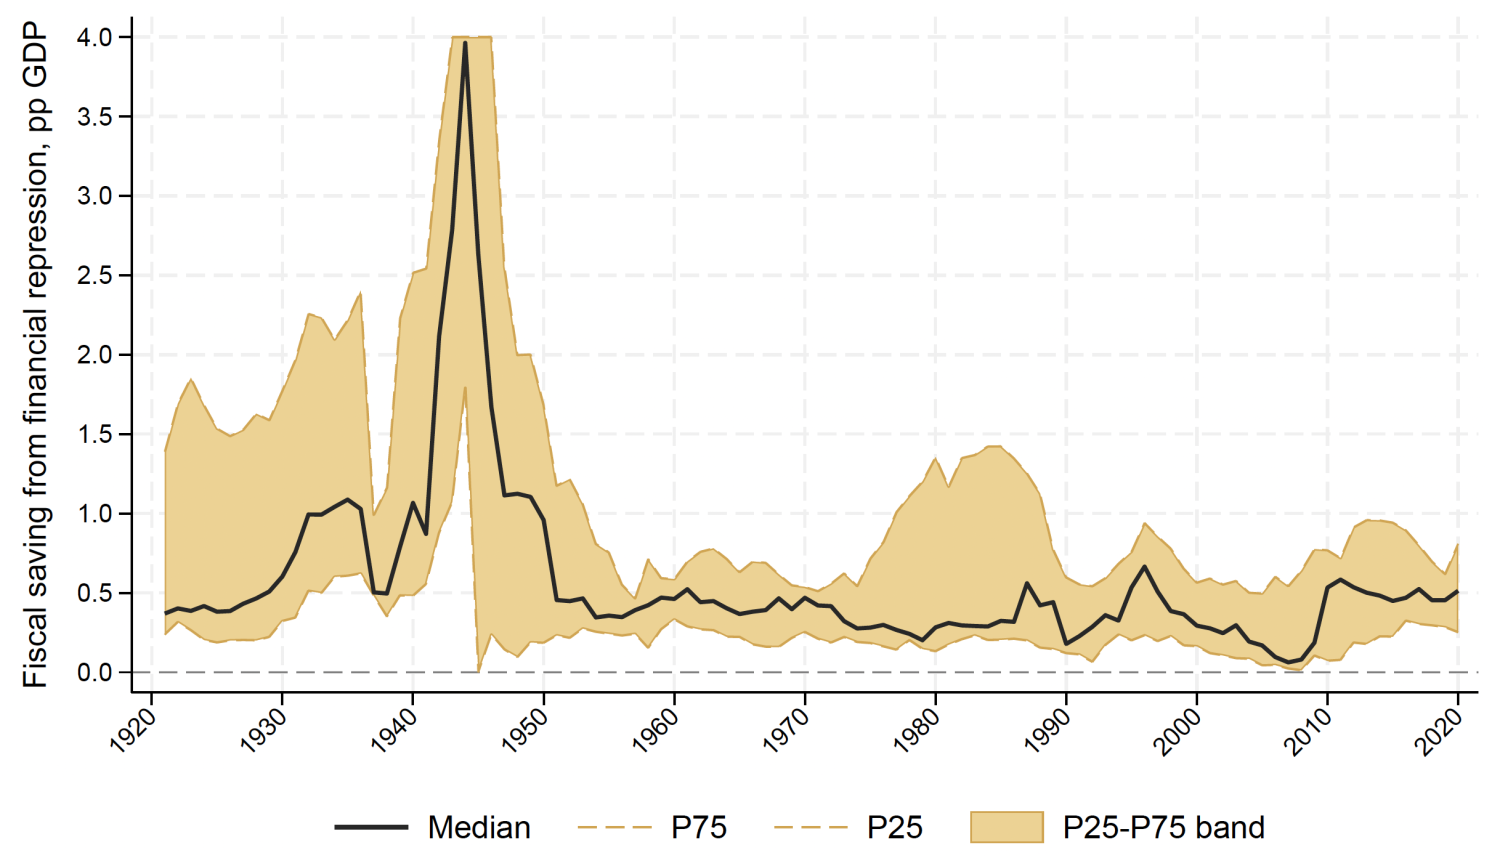
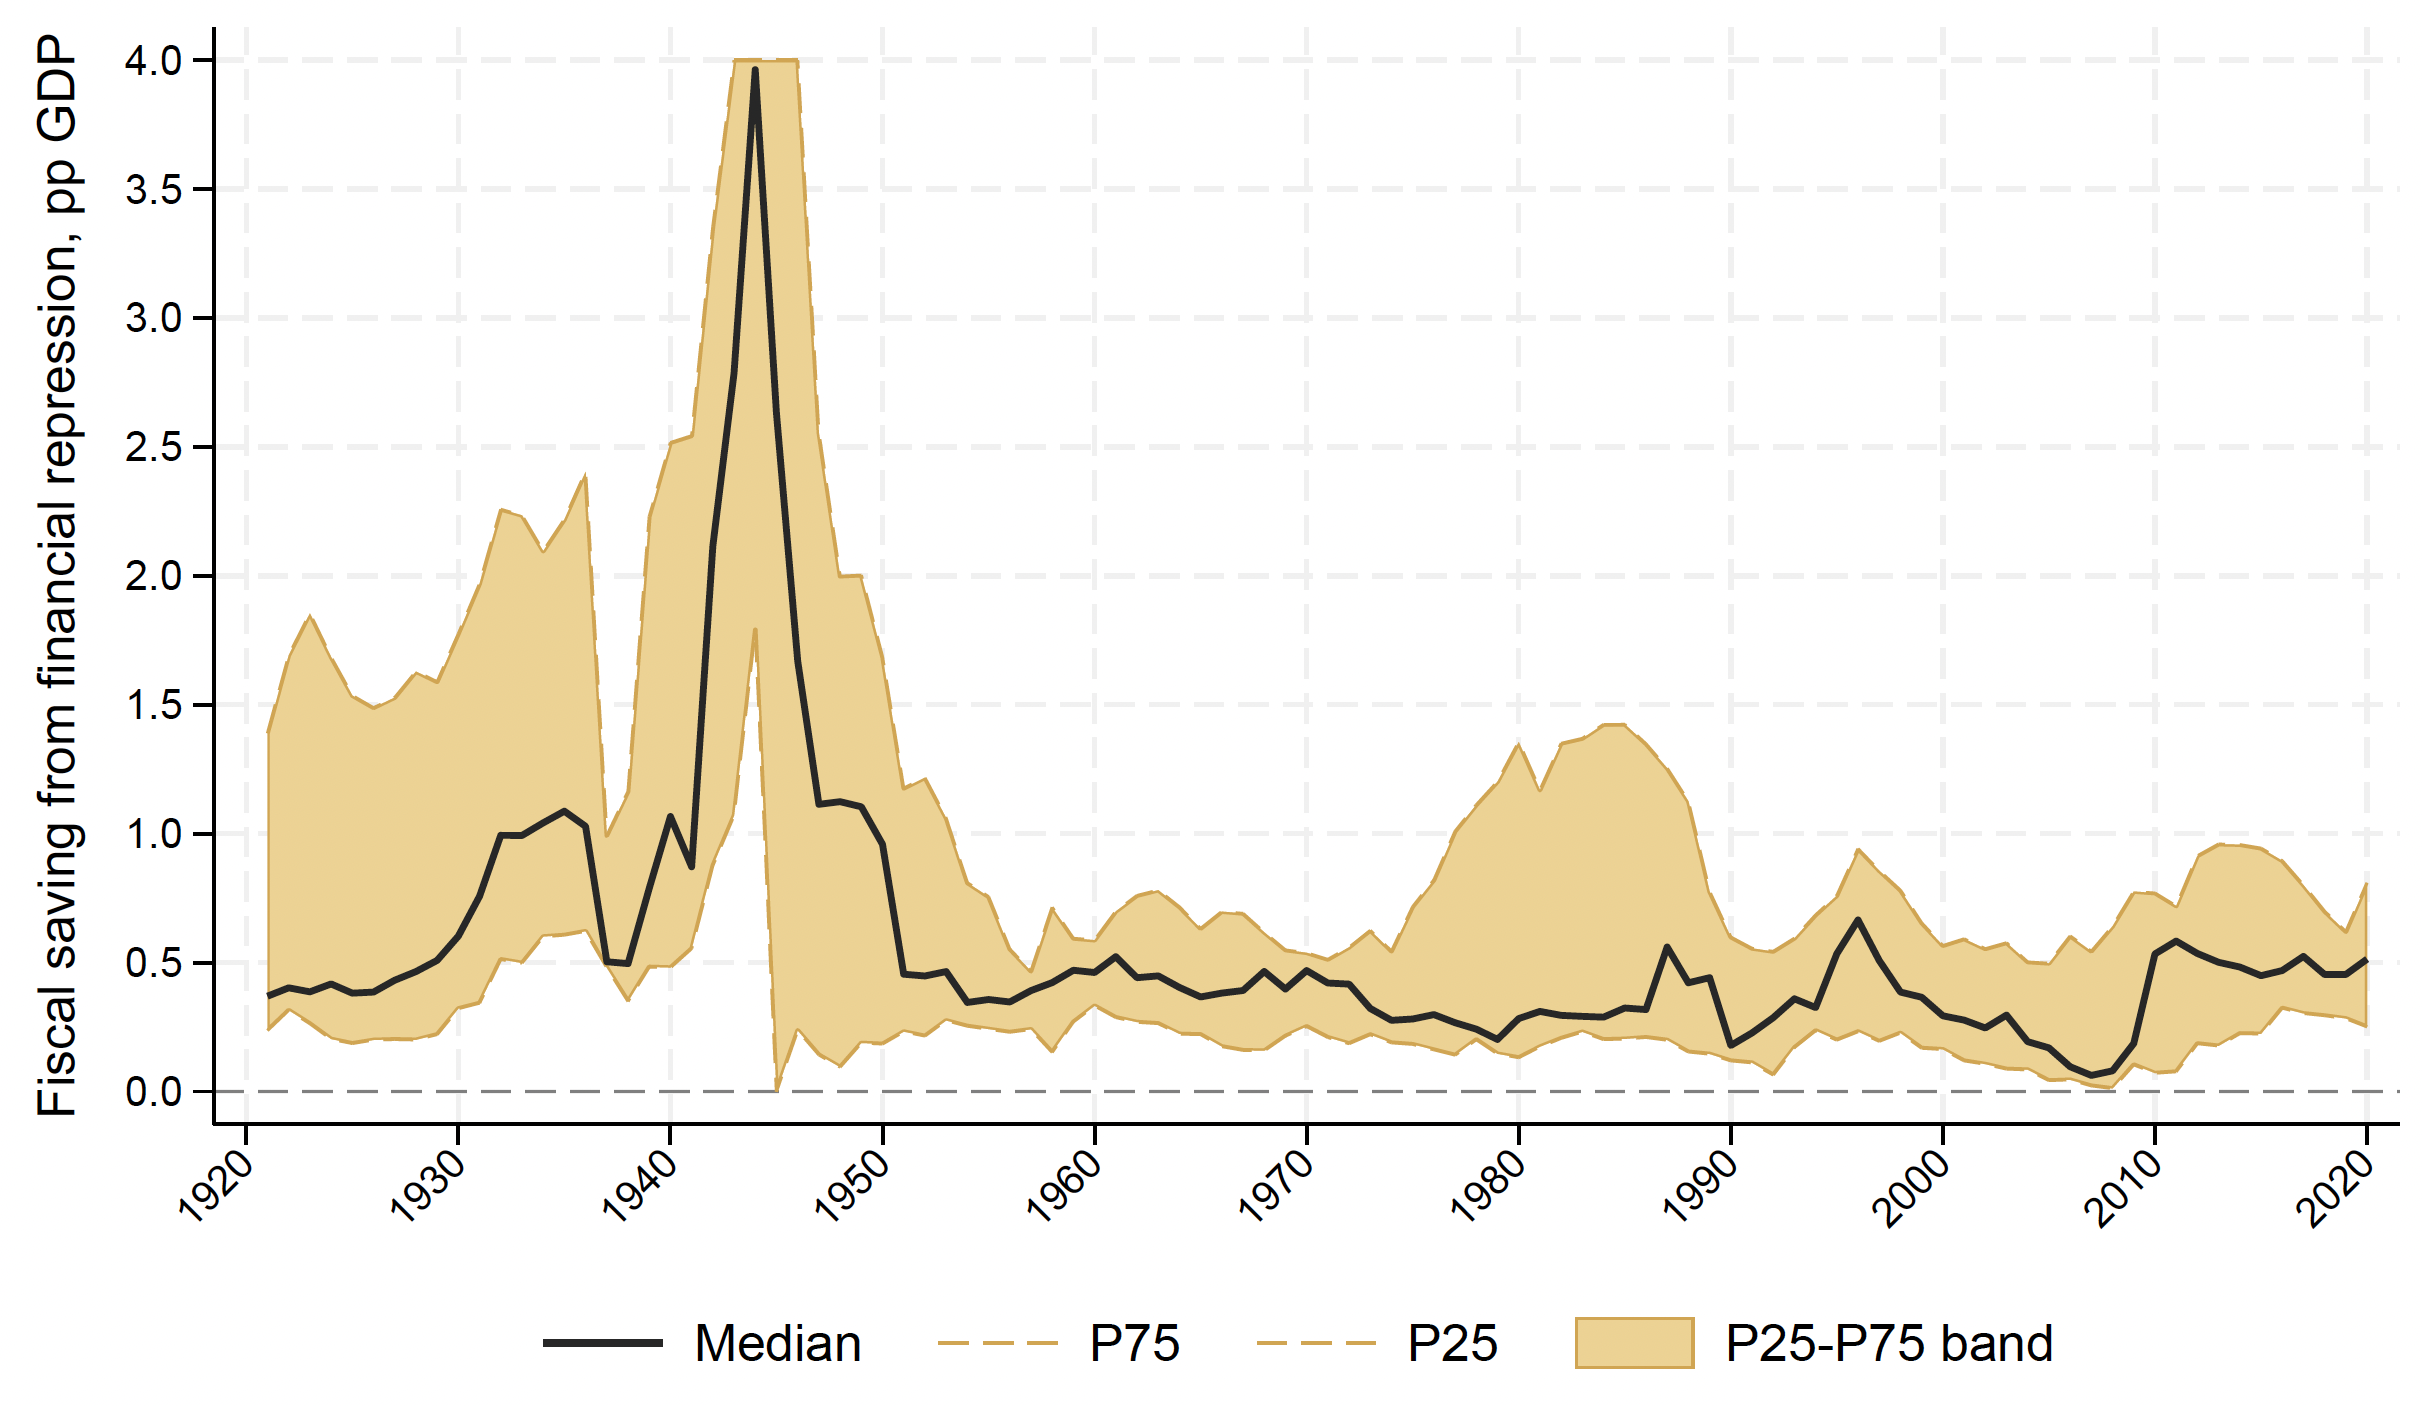
Note: The figure shows the cross-country distribution of fiscal savings from financial repression, in percentage points of GDP. The solid line denotes the cross-country median and the shaded area the interquartile (P25–P75) range.
Source: Bolhuis et al. (2026).
Looking ahead
With both indicators rising since the Global Financial Crisis and several conditions historically associated with repression present today, financial repression could become more prevalent in the years ahead.
None of this implies a simple replay of the postwar period. Then, captive domestic institutions, closed capital accounts and a limited range of substitute assets made it easier to channel savings into public debt at administered terms. Today, capital accounts are more open, markets are globally integrated, and investors have many more alternatives, including outside the banking system. As a result, modern forms of financial repression could operate through different channels, unless the regulatory perimeter or limits on capital mobility change substantially.
Ultimately, our analysis is descriptive rather than predictive: it provides a way to identify and quantify financial repression and shows the macro-financial conditions under which it has historically become more prevalent. Whether the recent rise persists, and whether it proves as fiscally important as after WWII, remain open questions.
Source : VOXeu