


Europe’s automotive industry is undergoing a significant transformation. This column uses firm-to-firm data to map the Italian automotive supply chain, covering both direct suppliers and firms connected through indirect linkages. Around 40% of the value added of the supply chain is generated by car manufacturers, with the remaining 60% split between direct suppliers and indirect suppliers. The supplier network is diverse across sectors and regions of Italy, reflecting both agglomeration forces and long-standing patterns of industrial specialisation. It estimates that demand shocks to the automotive sector would propagate through the supply chain and lead to large network multipliers.
Europe’s automotive industry is one of the continent’s key industrial sectors, not only because of its direct contribution to employment, value added, and R&D expenditure, but also because it anchors a vast network of suppliers across the economy. Today, it is undergoing its most profound transformation in decades. The transition to electric vehicles, the evolving regulatory framework for decarbonisation, growing competitive pressure from Chinese manufacturers, and the international reorganisation of production have placed the sector at the centre of the policy debate (Draghi 2024). Against the backdrop of diminishing production levels in Italy and across Europe (ACEA 2025), attention often remains focused on car manufacturers, even though the effects of the industry’s restructuring are likely to extend to a much broader ecosystem of suppliers. Understanding how these firms are connected is therefore central to assessing industrial resilience, as production-network linkages can transmit shocks across firms, sectors, and regions, and generate sizeable indirect effects (Acemoglu et al. 2016, Baqaee and Farhi 2019, Baldwin and Freeman 2022).
In a recent paper (Brugnara et al. 2026) we contribute to this discussion by mapping the Italian segment of the European automotive supply chain using firm-to-firm transaction data. Combining customs records with a novel business-to-business (B2B) transactions dataset that records the value of annual sales between domestic suppliers and buyers in Italy, we reconstruct firms’ actual buyer–supplier relationships. This allows us to identify not only direct suppliers to car manufacturers, but also firms connected to them through indirect supply chain linkages.
The results suggest that indirect relationships are quantitatively important. First-tier suppliers capture less than half of the value added generated by the supply chain. A substantial share of automotive exposure therefore lies deeper in the production network.
Why standard measures miss part of the supply chain
Existing approaches to mapping the automotive supply chain typically rely on industry classifications, sector-level input–output tables, or surveys. These methods provide useful aggregate evidence, but they cannot precisely reconstruct the actual network of buyer–supplier relationships, offering only a partial account of supply chain participation and providing limited detail on how exposure varies across firms, sectors, and regions.
To move beyond these limitations, we combine customs records with a new business-to-business dataset that records annual sales between Italian firms; the latter allows us to reconstruct buyer–supplier relationships within Italy, while the former identifies Italian firms selling to car manufacturers elsewhere in the EU. Starting from final car producers, we trace production linkages upstream, capturing both direct suppliers and firms connected to the automotive industry through indirect links. Our framework builds on the supply-side input–output approach of Ghosh (1958): a firm’s exposure to the automotive supply chain is defined as the share of its sales that ultimately reaches final car producers, either directly or indirectly through the production network. We then obtain automotive-related value added by applying these firm-level exposure coefficients to each firm’s value added.
A broader network than the car industry itself
Our estimates indicate that the Italian value added exposed to the automotive supply chain amounted to around €15.6 billion in 2022, 1.6% of value added in the non-financial, non-real-estate private sector. Roughly 143,000 Italian firms displayed some exposure to the European automotive industry, but only 8,000 were ‘significantly’ exposed (i.e. had more than 10% of their output linked to the industry).
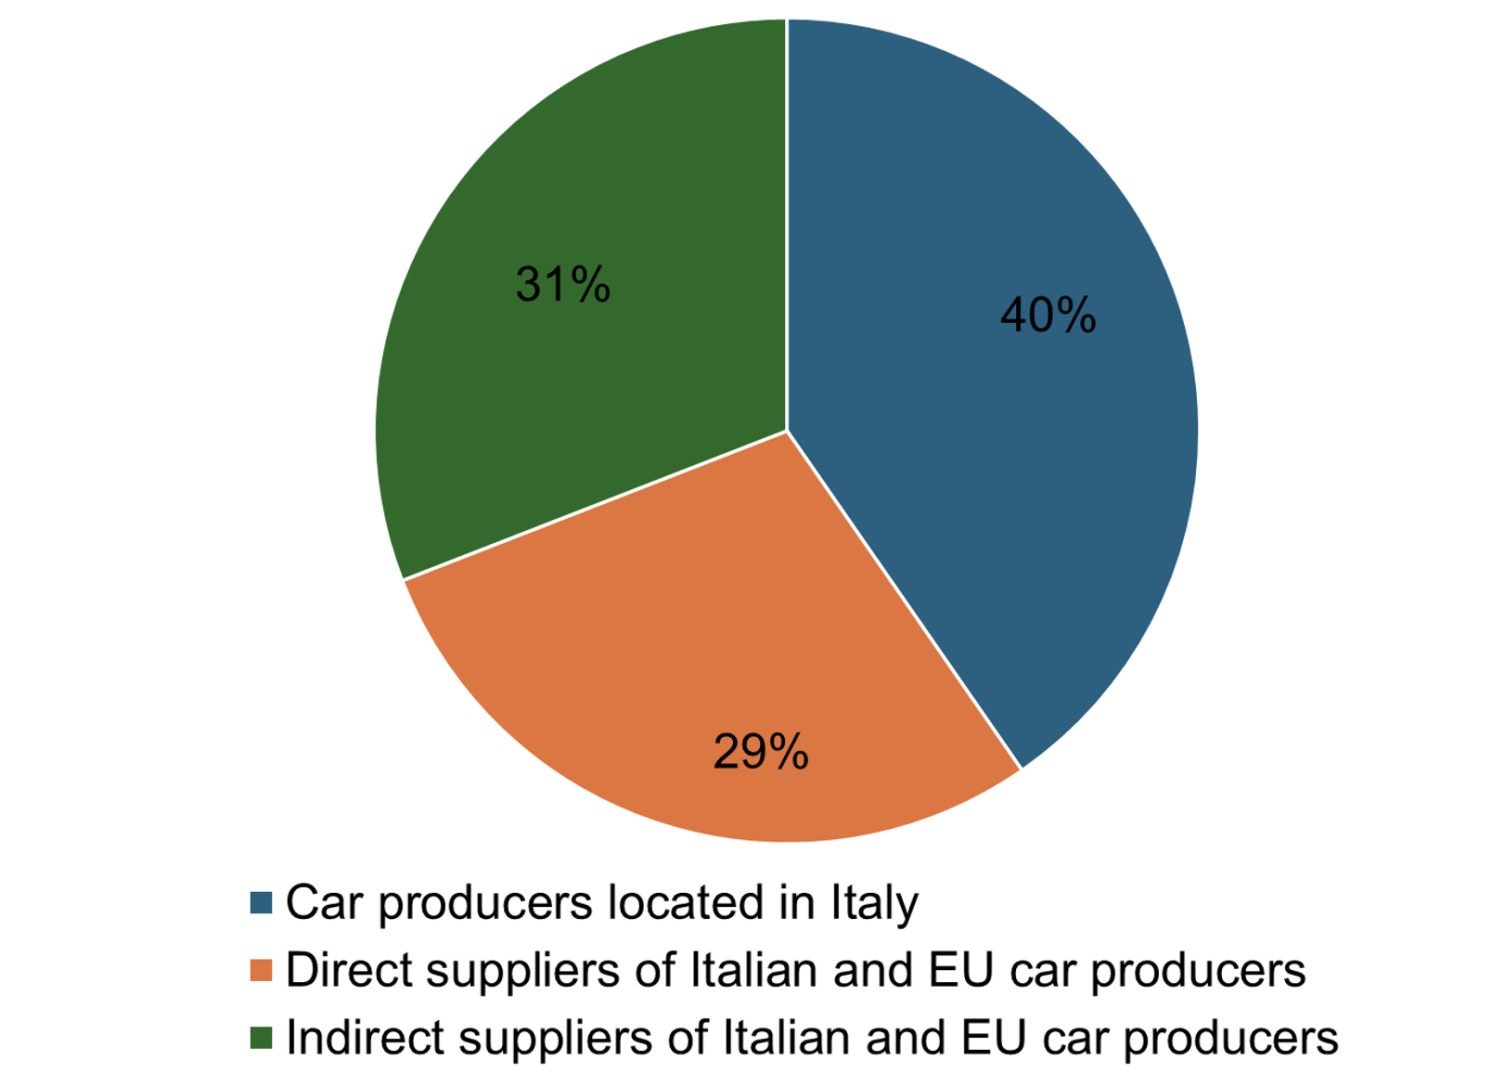
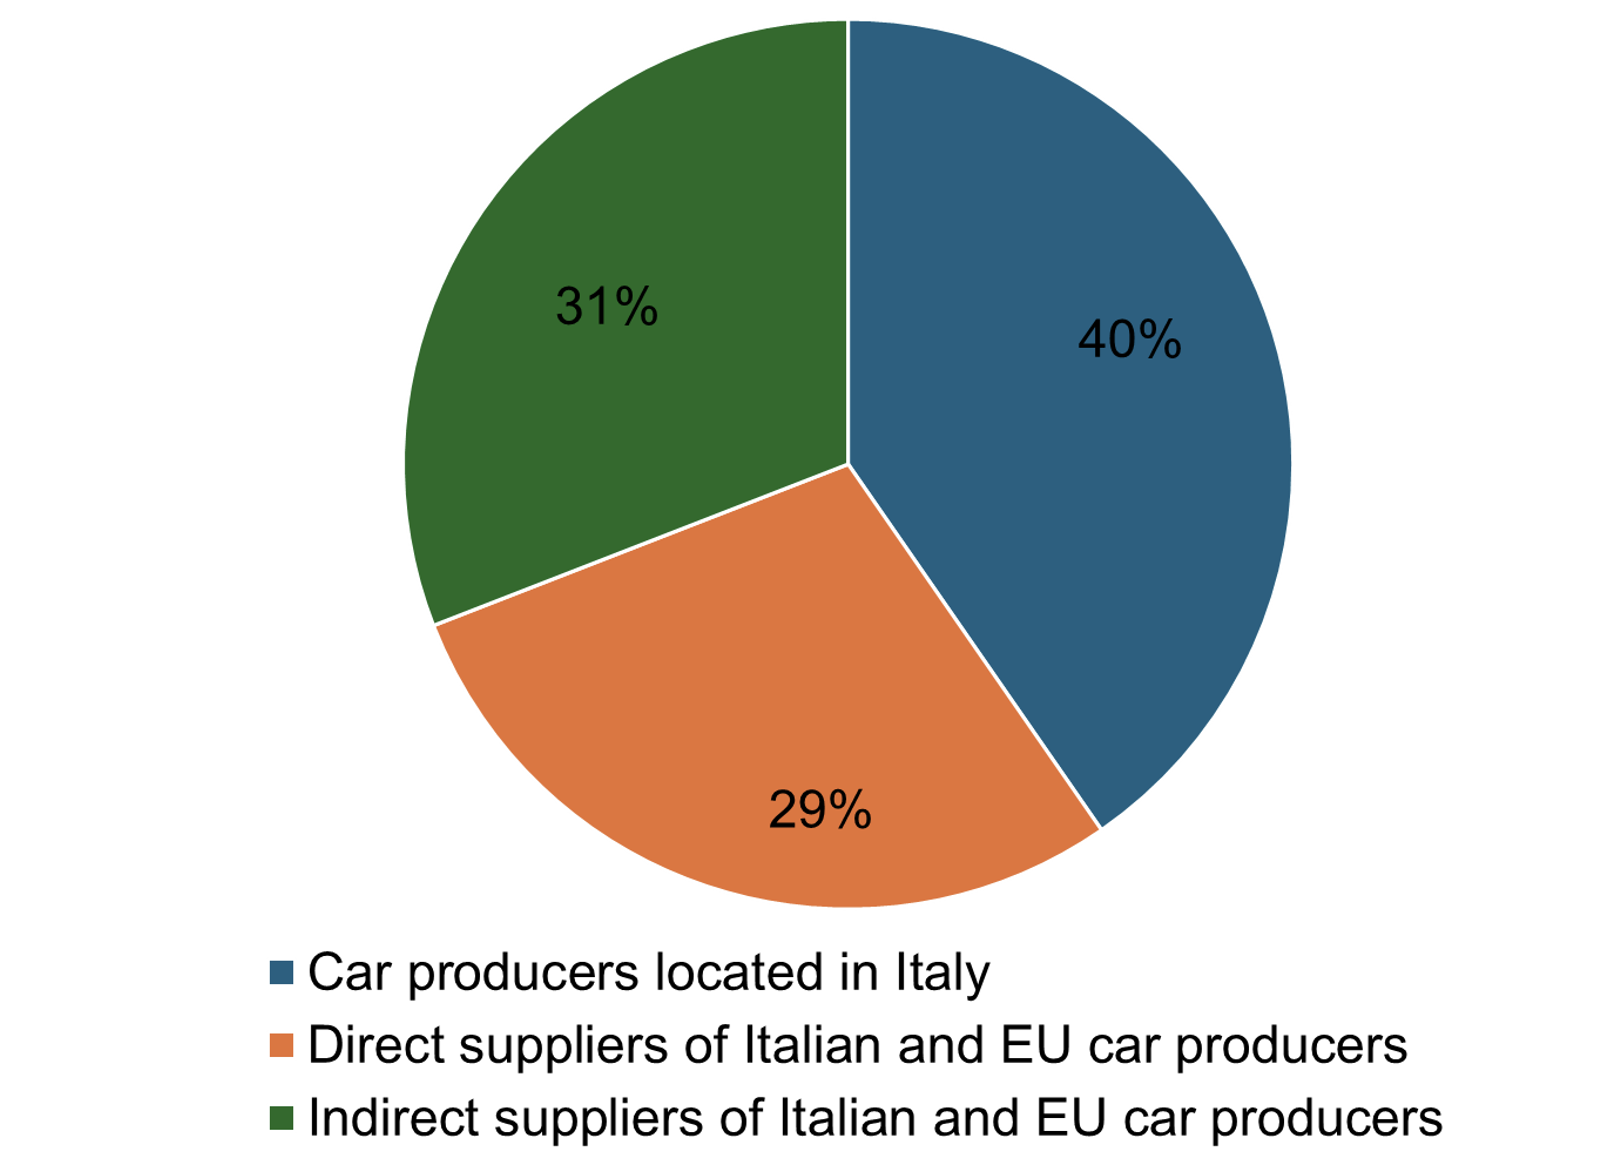
The composition of the exposure is informative. About 40% of the total consists of value added generated by car manufacturers located in Italy. The remaining 60% is generated by upstream suppliers: crucially, more than half of this figure is due to indirect trade relationships (Figure 1).
Figure 1 Composition of the value added of the supply chain
The supplier network is more diverse than conventional definitions of the automotive industry would suggest (Figure 2). Alongside traditional manufacturing sectors such as vehicle components, metals, machinery, rubber and plastics, services play an important role, particularly information and communications technology (ICT), wholesale trade, and logistics.
Figure 2 Sectoral composition of the automotive supply chain, 2022
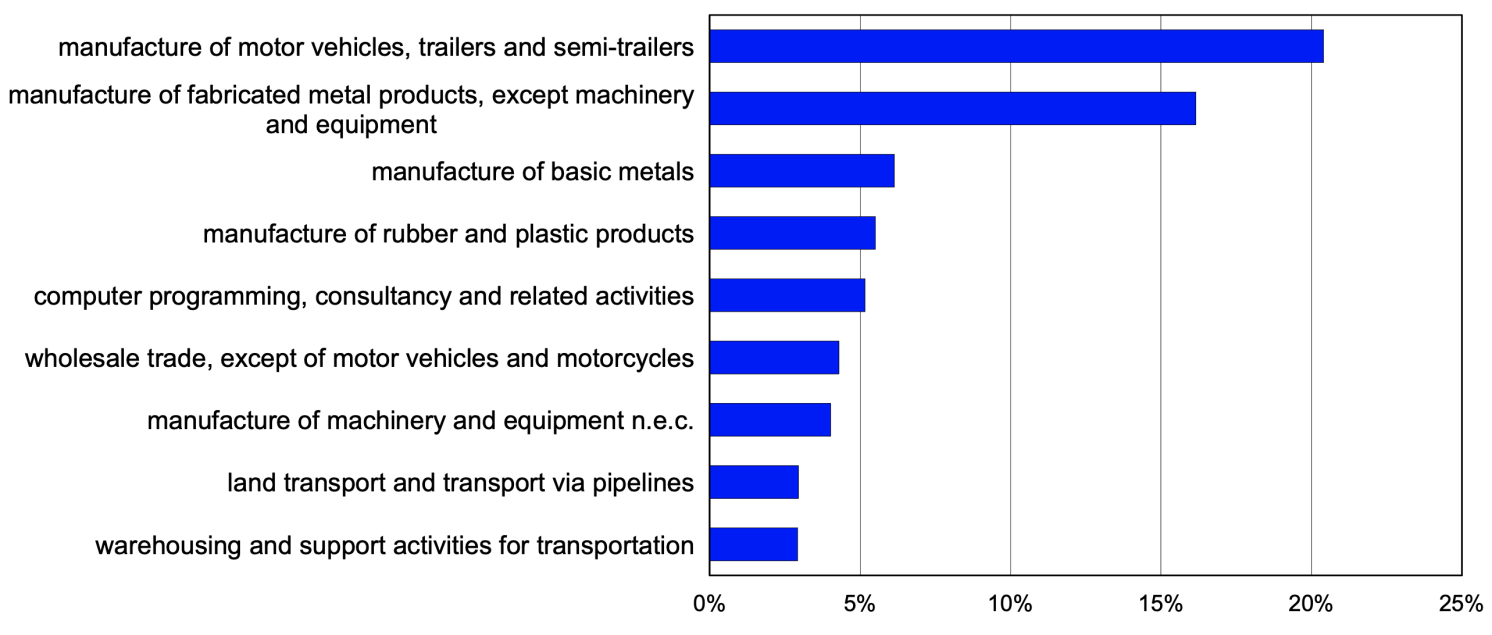
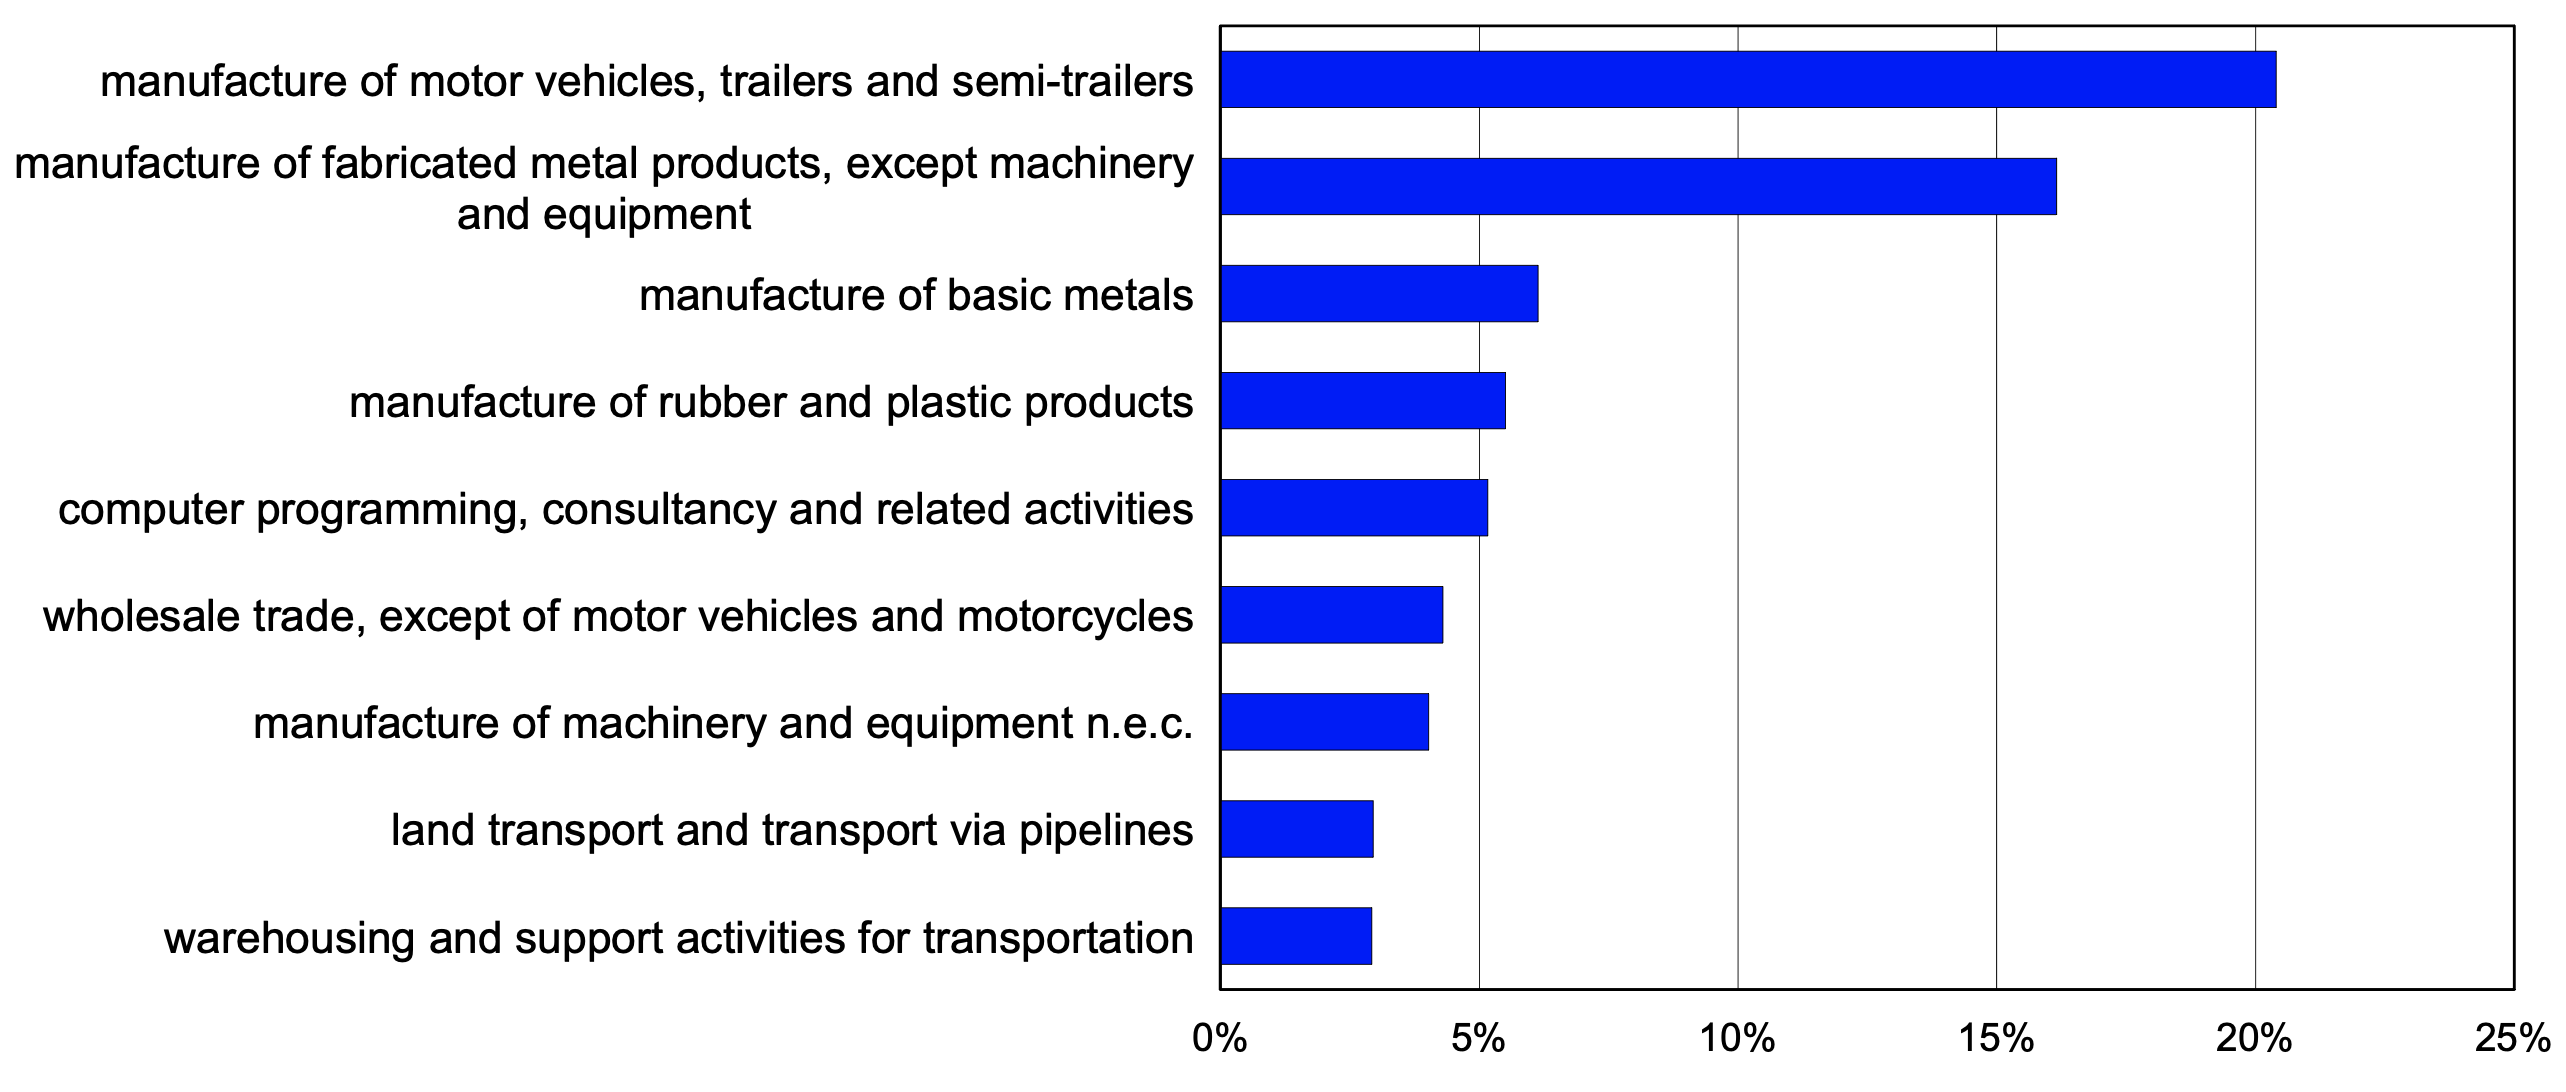
Note: Distribution of automotive-related value added across sectors. Final carmakers are excluded. Top ten sectors shown.
Furthermore, the geography of the automotive supply chain reflects the coexistence of two distinct forces. In absolute terms, activity is concentrated in the large industrial regions of Northern Italy: Piedmont and Lombardy alone account for more than half of total supply chain value added. This pattern is consistent with scale economies and agglomeration forces, which favour the concentration of upstream suppliers in larger and more diversified regional economies. However, relative exposure, measured as the share of automotive-related value added on total provincial value added in the non-financial, non-real-estate private sector, follows a different geography: it is highest in provinces hosting major car production plants, where long-standing patterns of industrial specialisation have created dense local production networks (Figure 3). As a result, smaller regions such as Basilicata and Abruzzo account for a limited share of the national supply chain but are disproportionately dependent on the industry.
Figure 3 Regional dependence on the automotive supply chain, 2022
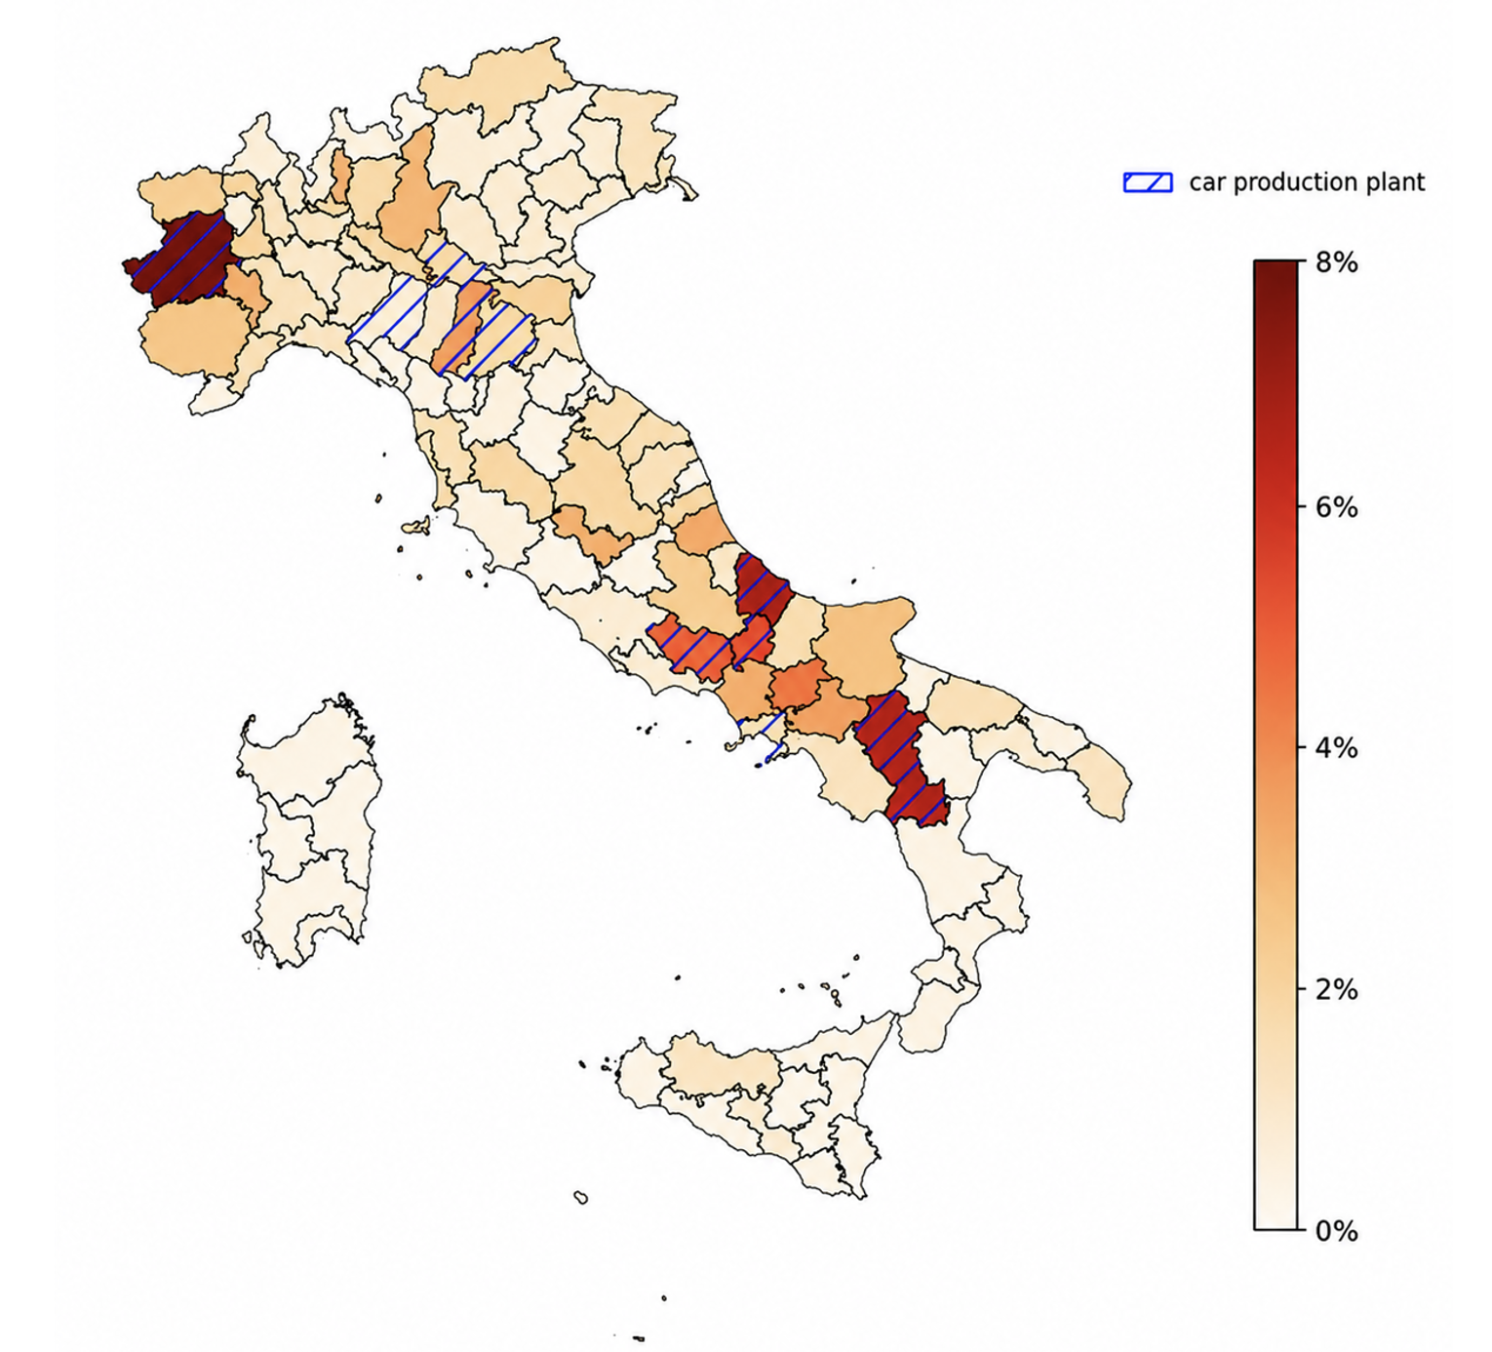
Note: Share of automotive-related value added on total provincial (NUTS-3) value added in the non-financial, non-real-estate private sector.
Indirect linkages amplify the impact of demand shocks
In the context of ongoing and prospective structural changes in the automotive sector, our mapping of the supply chain allows us to simulate how shocks to final demand for cars propagate through the upstream production network.
Embedding our firm-level estimates in a model à la Acemoglu et al. (2016), we find that a 1% decline in demand for European-produced vehicles would reduce value added among Italian car producers by approximately €63 million. An additional €93 million loss would be transmitted to upstream suppliers, bringing the total effect to around €156 million and implying a network multiplier of about 2.5. Restricting the analysis to direct suppliers would yield a substantially smaller multiplier of 1.7.
Who are the automotive suppliers?
Firms integrated into automotive supply chains differ systematically from other businesses. Compared with similar firms within the same sector, region, size class, and capital intensity, automotive suppliers tend to be larger and more productive; they also invest more heavily in both tangible and intangible assets and pay higher wages.
Innovation is also a defining characteristic. Direct suppliers to carmakers display a significantly greater propensity to patent, with innovative activity concentrated in transport technologies, mechanical systems, electrical machinery, and environmental technologies.
At the same time, these firms often depend on a relatively small number of customers, which might imply greater vulnerability to adverse shocks affecting downstream demand, relative to firms with a more diversified customer base.
Conclusions
Our recent paper shows how firm-level transaction data can be used to map production networks in industries with clearly identifiable final producers, providing a replicable framework for measuring supply chain exposure and the transmission of demand shocks. Overall, our findings carry several policy implications.
First, our analysis shows that indirect linkages matter. Focusing exclusively on first-tier suppliers captures only part of the production network and substantially understates the aggregate effects of shocks. Firm-level transaction data make it possible to recover these indirect relationships, providing a more accurate picture of supply chain exposure and shock propagation.
Second, according to our estimates, downturns in demand for cars produced in the EU are likely to have the strongest effects in less diversified regional economies that depend heavily on the automotive industry. The territorial patterns documented in the paper reflect the coexistence of two forces shaping the geography of the supply chain: agglomeration effects, which concentrate upstream suppliers in large industrial regions, and long-standing local specialisations centred around major vehicle production plants. As a result, relatively small regions hosting assembly facilities may display disproportionately high exposure to sector-specific shocks.
Finally, our findings show that sector-based classifications provide an incomplete picture of supply chain exposure. Many firms classified in the motor vehicle sector sell a substantial share of their output outside the automotive industry, while many firms outside the sector are connected to car manufacturers through indirect buyer–supplier relationships. Policies based solely on sectoral classifications may therefore overlook a significant share of the firms ultimately affected by structural changes in the industry.
Source : VOXeu