


Existing views on what venture capital finances and how its markets are structured are primarily shaped by the experience of the US and a few other high-income economies. This column presents evidence covering nearly 270,000 venture capital-backed startups in over 150 economies to provide a more complete picture. Venture capital markets differ across countries in size and also in kind. At lower levels of economic development, the composition tilts away from knowledge intangibles towards organisational intangibles. Yet differences in what venture capital finances tell only part of the story. Most of the cross-country gap in venture capital activity is associated with how many startups enter the funding pipeline rather than how much each raises.
The standard view of venture capital (VC) is built largely on evidence from high-income economies, where VC is closely associated with R&D, frontier technologies, patenting, and high-growth technology firms (Lerner and Nanda 2020). This view is reinforced by evidence that VC-backed firms make outsized contributions to innovation and aggregate growth (Samila and Sorenson 2011, Akcigit et al. 2019). Recent work, however, suggests that VC markets may vary both in what they finance and in their depth. Zhestkova et al. (2020), for example, examine how cross-border venture investment can facilitate technology flows between countries.
In a recent study (Reyes et al. 2026), we add a global dimension to this analysis. The question is not only how much VC an economy attracts, but what that VC finances. This varies systematically with the level of development. In high-income economies, VC is more closely tied to knowledge intangibles, which reflect the creation of new knowledge and technology. In developing economies, VC tilts more toward organisational intangibles, which capture the know-how needed to deploy and scale business models. This suggests that VC may generate value through different channels across economies, with gains in developing economies coming more from the deployment and adaptation of existing technologies than from new technological discovery.
A new global view of venture capital
To study these issues, we combine two of the largest global sources of VC data – PitchBook and Crunchbase – using a multi-stage firm-matching procedure, and link the resulting dataset to equity issuance data from London Stock Exchange Group (LSEG). The final sample contains nearly 270,000 VC-backed startups and more than 527,000 deals across more than 150 economies. The analysis focuses on 2012–2023, when coverage is most consistent across regions.
Combining the two sources yields sizable gains, especially outside the major VC hubs. Across regions, harmonisation adds up to 42.3% more deals and 29.7% more VC volume relative to PitchBook alone. Among income groups, the gains are largest in upper-middle-income countries, with 22.2% more volume for the median country and 17.4% in the aggregate across the group. This broader coverage allows us to compare both the scale of VC markets and what they finance.
VC is small relative to GDP but central to equity financing
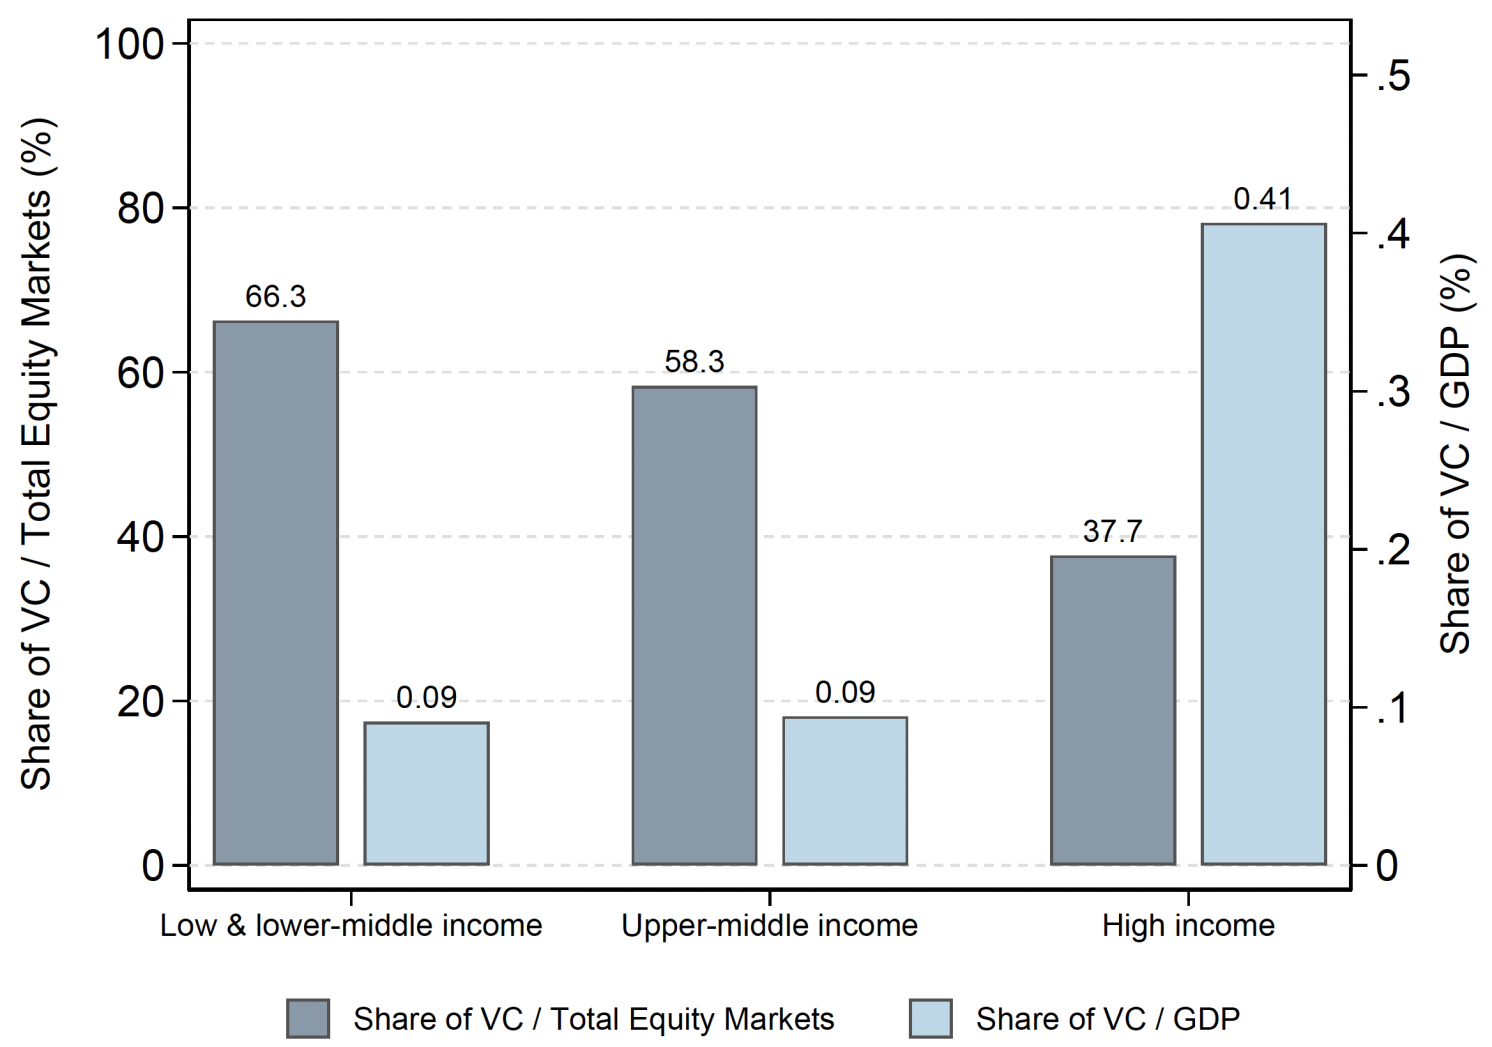
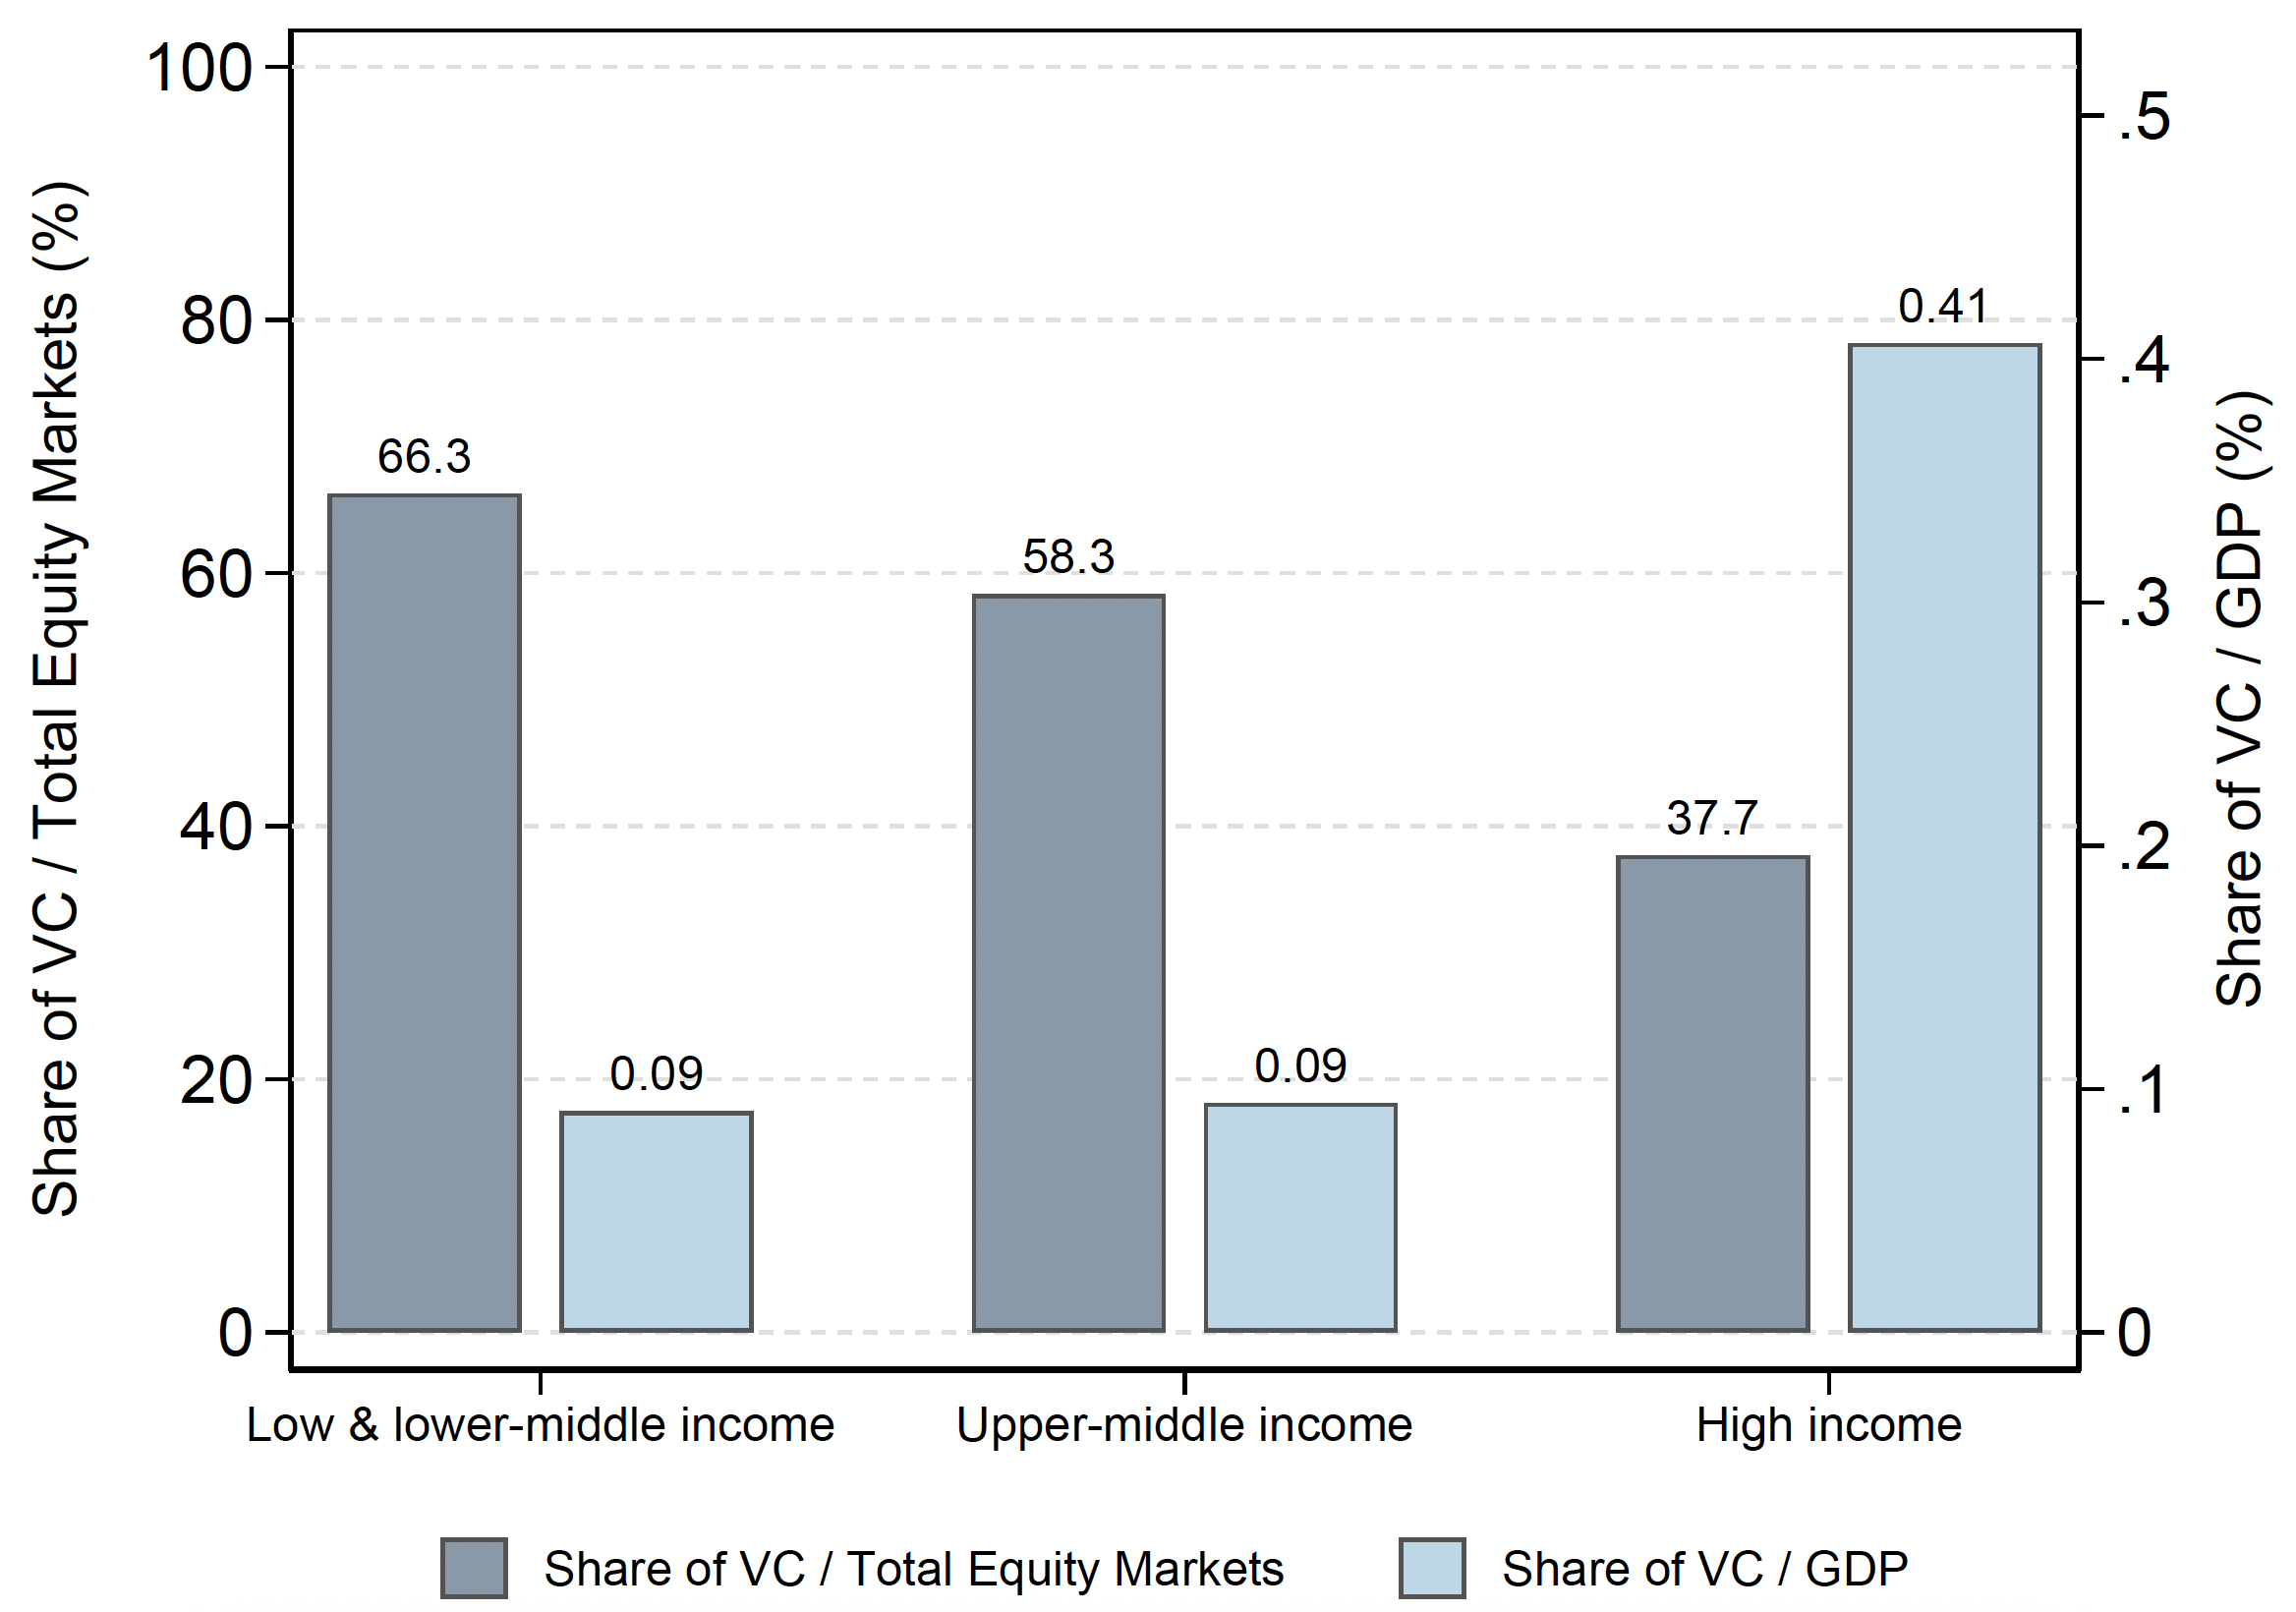
VC activity relative to GDP rises strongly with income. In 2021–2023, VC amounted on average to 0.41% of GDP in high-income countries, compared with only 0.09% in low- and middle-income countries. But the pattern reverses when considering VC’s role relative to equity financing options available to firms.
VC represented on average 66% of total equity financing in low- and lower-middle-income economies, and 58% in upper-middle-income countries compared to 38% in high-income economies (Figure 1). In many developing economies, public equity issuance and private equity remain thin, making VC a disproportionately important source of equity finance for young firms.
Figure 1 Venture capital is small relative to GDP but central to equity financing
Source: Reyes et al. (2026)
Notes: This figure compares the role of venture capital across country income groups during 2021–2023 using two measures. The dark bars, reported on the left axis, show VC as a share of total equity financing, defined as VC volume divided by the sum of VC, public equity issuance, and private equity growth investment. Country-level shares are averaged within each income group using population weights. The light bars, reported on the right axis, show VC volume as a share of GDP over 2021–2023 and are calculated as the unweighted average across countries within each income group. Income groups follow the World Bank’s 2025 income classifications.
What VC finances changes across countries
The differences go beyond scale. VC is particularly well suited to financing intangible-intensive firms. These firms can be difficult to finance through conventional debt markets because they often lack collateralisable assets and face substantial uncertainty and information asymmetries.
The standard view, shaped largely by evidence from the US and other high-income economies, emphasises knowledge intangibles: investments that create new knowledge, such as R&D, intellectual property, algorithms, and frontier technology. However, intangible capital also includes organisational capabilities – to organise operations, reach customers, and bring products to market. Examples include distribution networks, logistics systems, marketplaces, brands, and human capital. In developing economies, these capabilities may be especially valuable because firms often create value by adapting and deploying existing technologies to overcome gaps in distribution, payments, and market access. Our global evidence suggests that VC finances both types of intangibles, but the balance between them changes with the level of development.
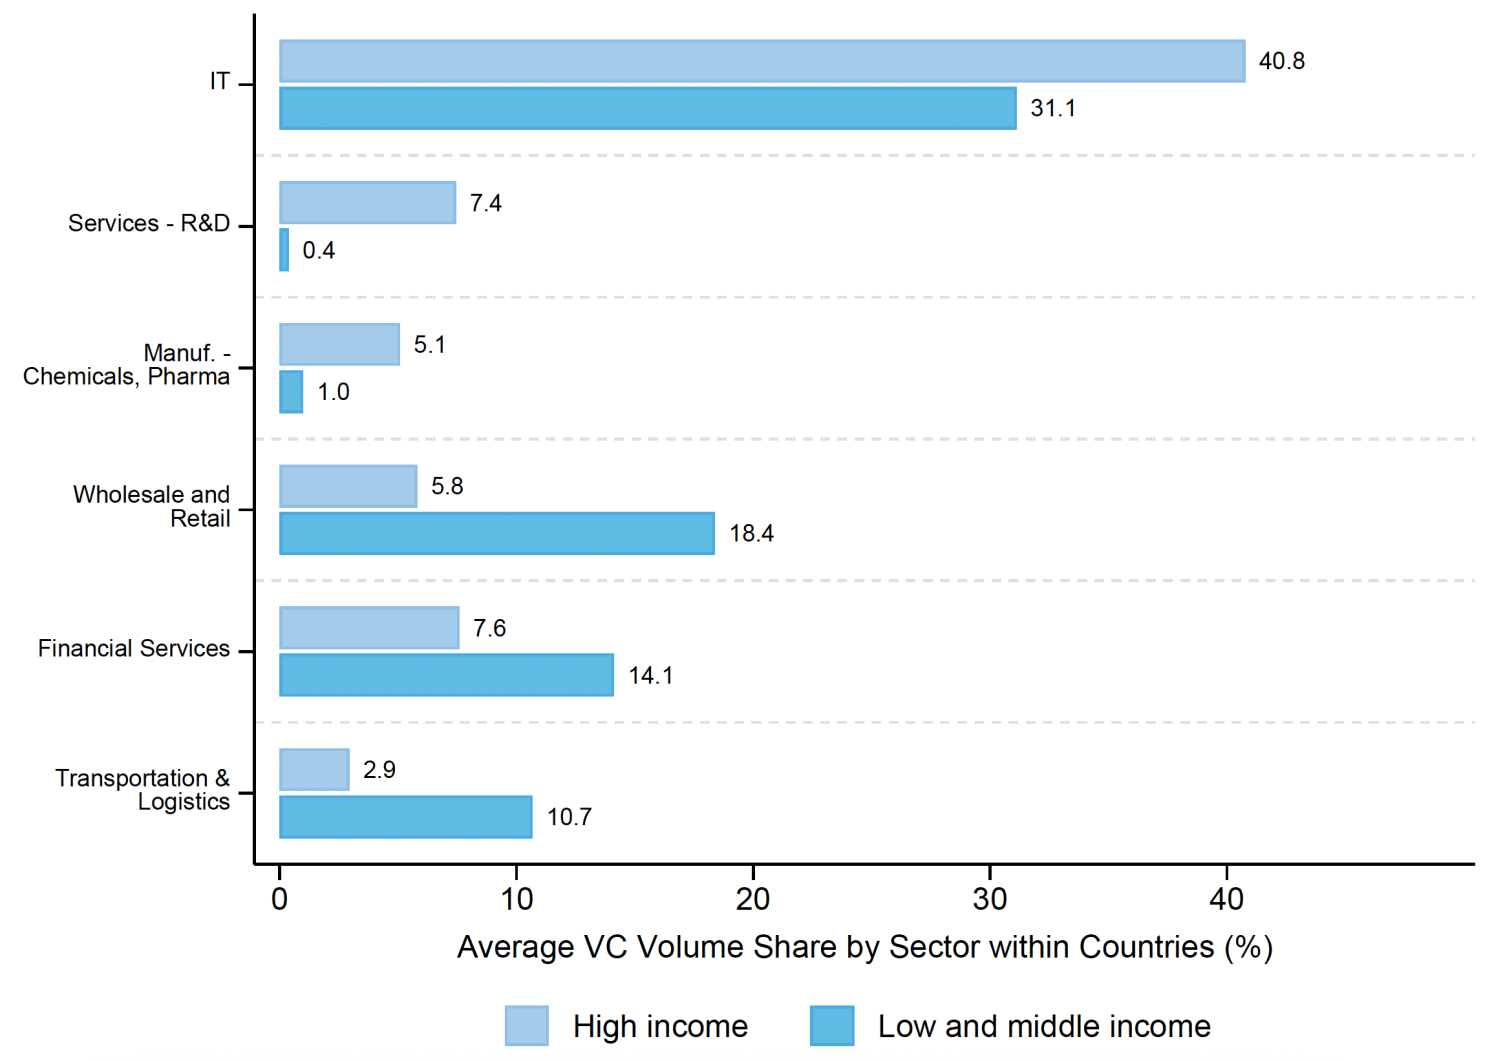
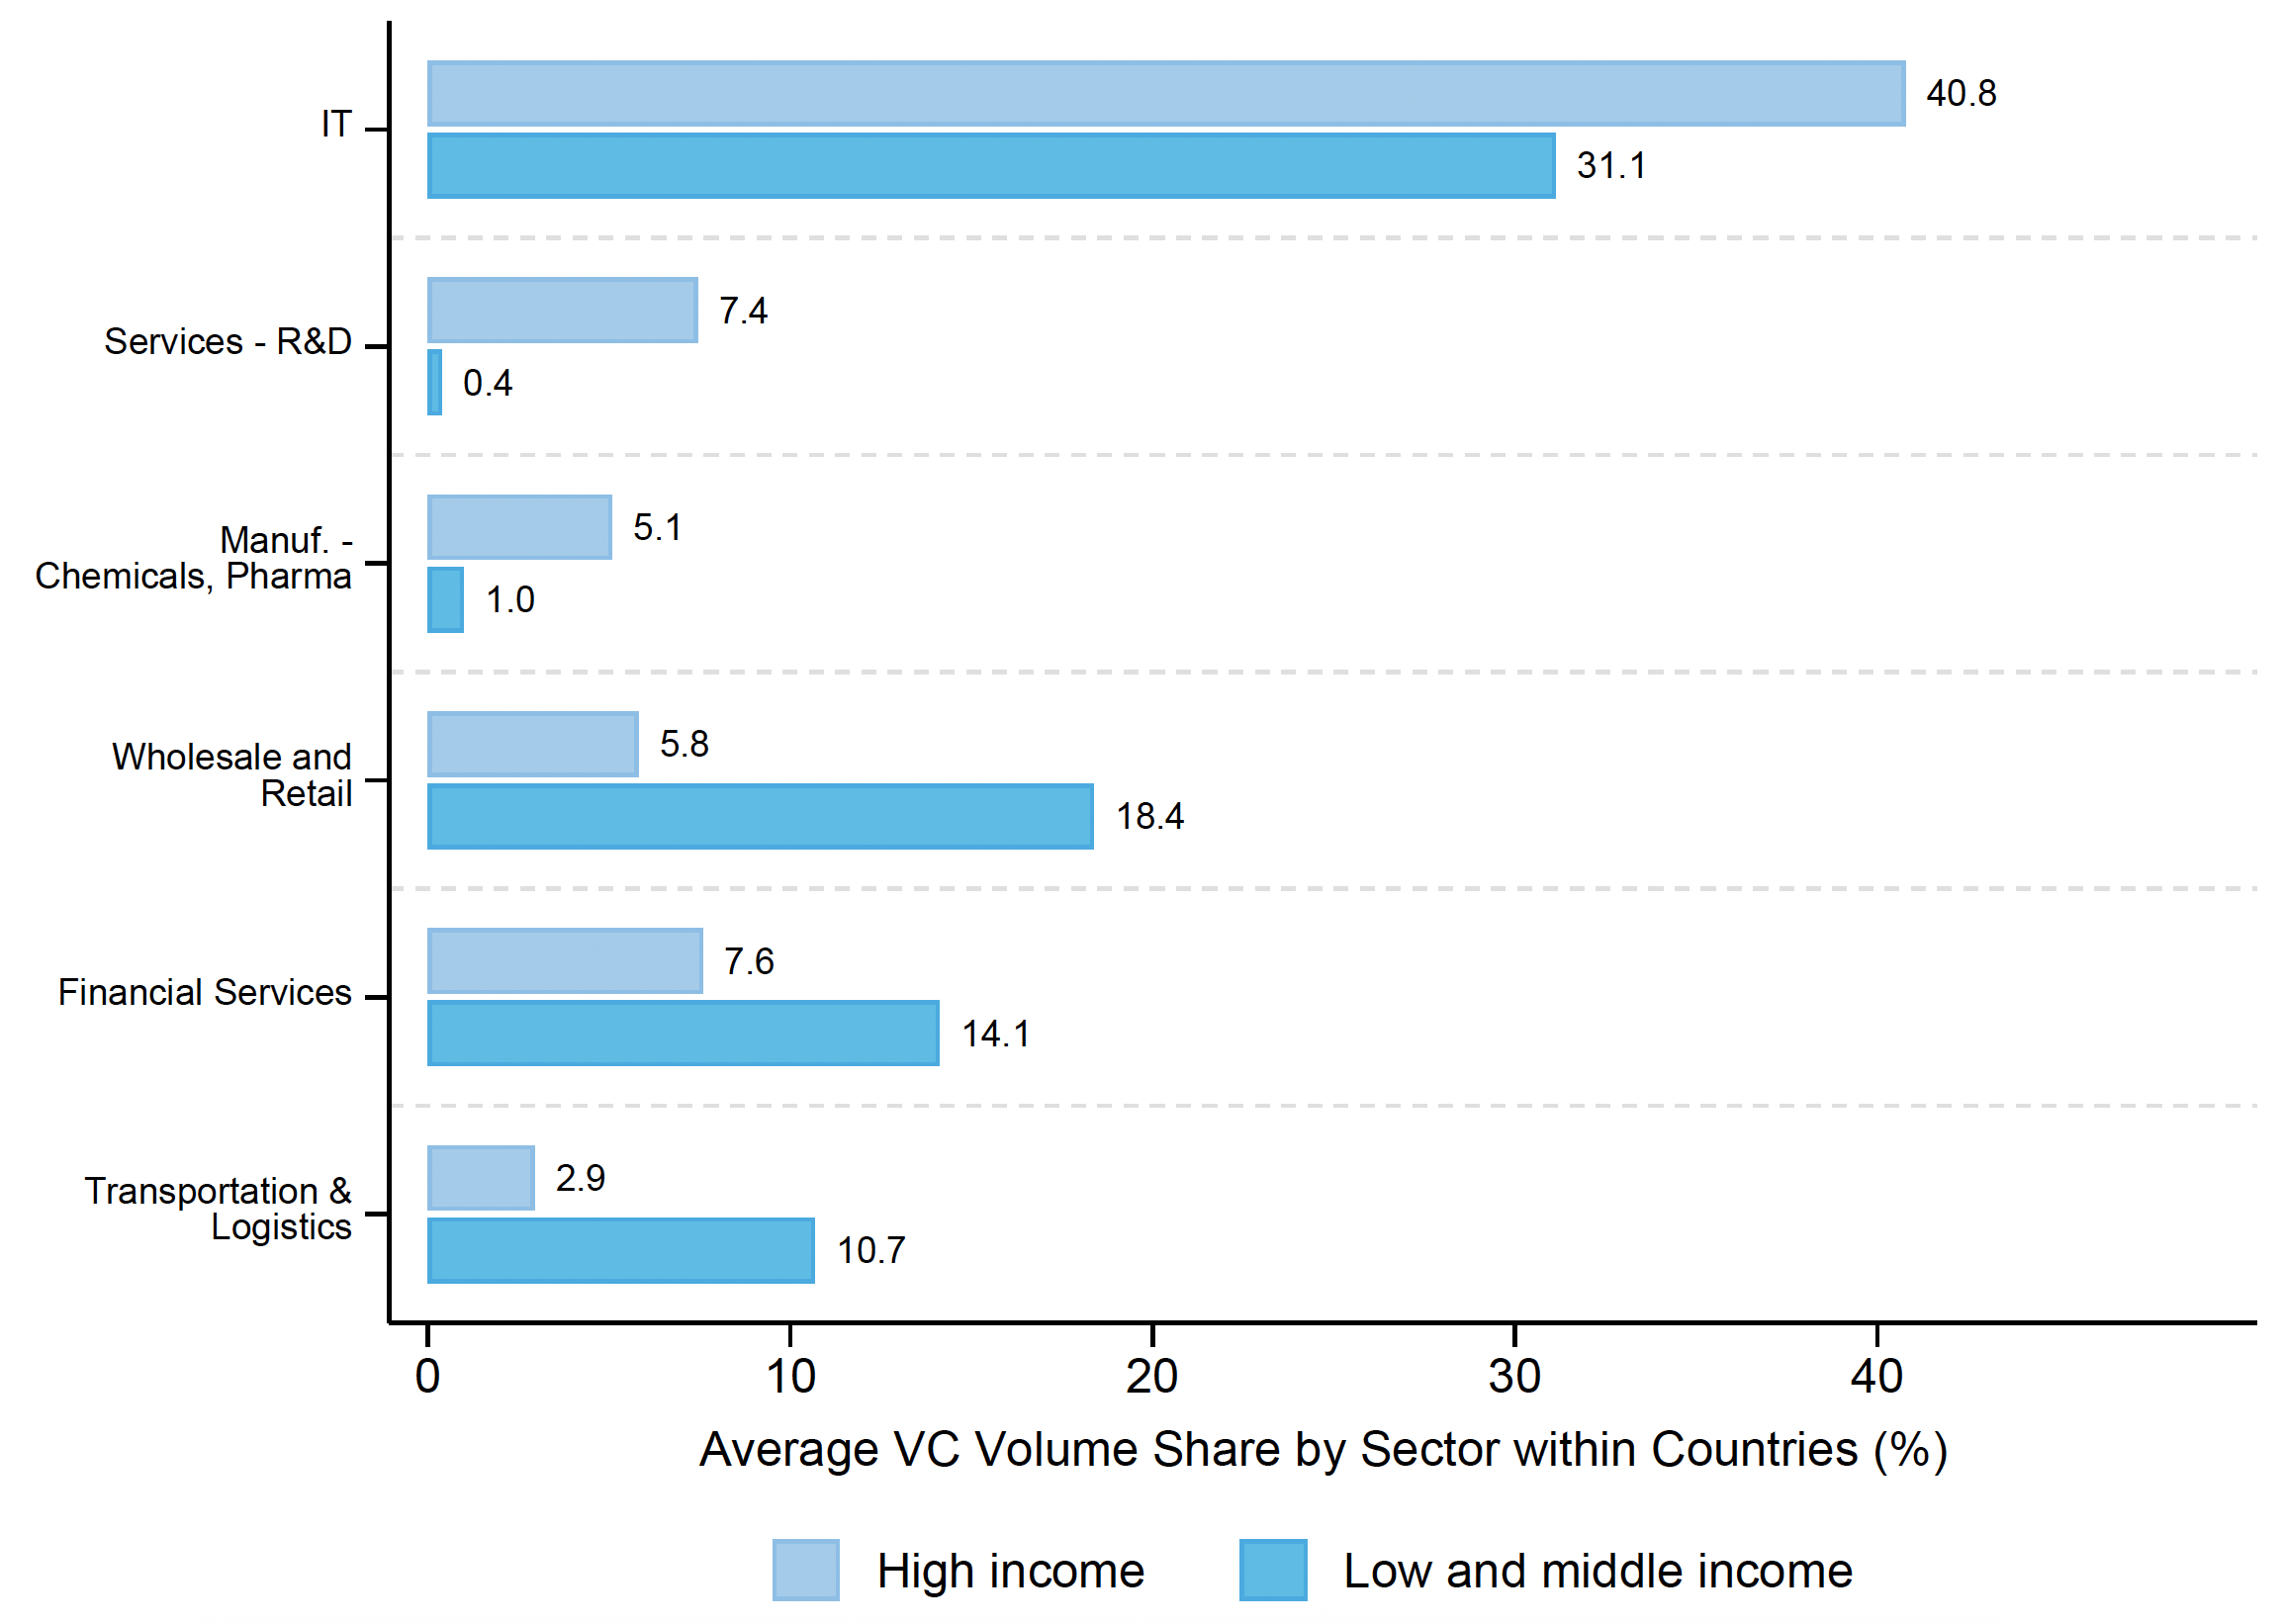
The sectoral patterns are consistent with this distinction (Figure 2). In high-income economies, VC investments go more towards IT, R&D services, or manufacturing of chemicals and pharmaceuticals. By contrast, investors are seeing in developing countries more opportunities in other sectors. Wholesale and retail account for 18.4% of VC volume in low- and middle-income countries, versus 5.8% in high-income countries. Transportation and logistics account for 10.7%, well above the high-income share of 2.9%.
Figure 2 Venture capital finances different sectors across income groups
Source: Reyes et al. (2026)
Notes: This figure compares the average sectoral distribution of VC volume within countries across high-income and low- and middle-income countries over 2012–2023. For each income group, the figure reports the average share of total VC volume accounted for by each selected sector, weighted by country GDP. The first three sectors—IT, Services–R&D, and Manufacturing–Chemicals and Pharmaceuticals—are sectors in which the average VC share is higher in high-income countries, whereas the remaining three sectors—Wholesale and Retail, Financial Services, and Transportation and Logistics—are sectors in which the average VC share is higher in low- and middle-income countries. Sectoral groupings are based on ISIC classifications, and income groups follow the World Bank’s 2025 income classifications. Values are expressed as percentages of total VC volume within countries. China is excluded from the analysis.
The pattern also appears in firms’ own descriptions of what they do. Based on text analysis, VC-backed firms in high-income economies are more likely to use knowledge-oriented terms than those in developing economies (16% versus 10%). By contrast, firms in low- and lower-middle-income economies are more likely to use organisational terms than those in high-income economies (18% versus 9%). These differences persist even within IT, suggesting that the pattern is not simply driven by differences in sectoral composition across countries.
This compositional shift is specific to VC. Public equity markets have much more similar sectoral profiles across income levels. The result is also robust to alternative sample definitions, such as excluding China and India, dropping pre-seed and seed deals, and restricting the firm-level analysis to the IT sector.
The biggest global gap is getting firms into the pipeline
To understand why VC activity differs so much across countries, we decompose VC activity into two margins: entry, measured by seed deals per capita, and funding depth, measured by the amount of capital attracted per entrant.
Across income groups, entry is the larger divide. The median high-income economy generates roughly 40 times more seed deals per capita than the median low- and lower-middle-income economy and 11 times more than the median upper-middle-income economy. Funding per entrant also differs, but less so (4 times relative to developing countries).
Among developing economies, where entry tends to be low, funding depth therefore plays a larger role in distinguishing relatively active VC ecosystems from inactive ones. This distinction matters for policy. An economy where too few startups enter the VC pipeline faces different policy questions from one where startups enter but raise little capital once they do.
The decomposition also helps clarify how the business environment relates to VC activity, and what it finances. For each business environment condition, we measure how much of its association with VC activity runs through entry and how much through funding depth. The results show that for most variables, the association with VC runs through entry. Political stability and tax structure variables primarily run through entry, whereas deeper equity markets run through funding per entrant. Moreover, we find that entry into knowledge-intensive sectors is the most sensitive to business-environment conditions. These differences are consistent with firms in knowledge-intensive sectors facing longer time-to-profit horizons and depending more on public equity exits, both of which leave them more exposed to institutional and policy conditions.
No single model for venture capital, and different questions for policy
Overall, the evidence suggests that venture capital does not follow a single model to be replicated across countries. This shifts the questions policymakers need to ask. The first is how to bring more startups into the pipeline in developing economies. The second is what VC-backed organisational innovation delivers. Its gains may come through better distribution, market creation, financial inclusion, or the adaptation of existing technologies rather than through patents or R&D, but these spillovers remain largely unmeasured. A third is whether startups that do enter can raise enough capital to scale. Answering these questions will be key to expanding financing for young innovative firms in developing economies.
Source : VOXeu