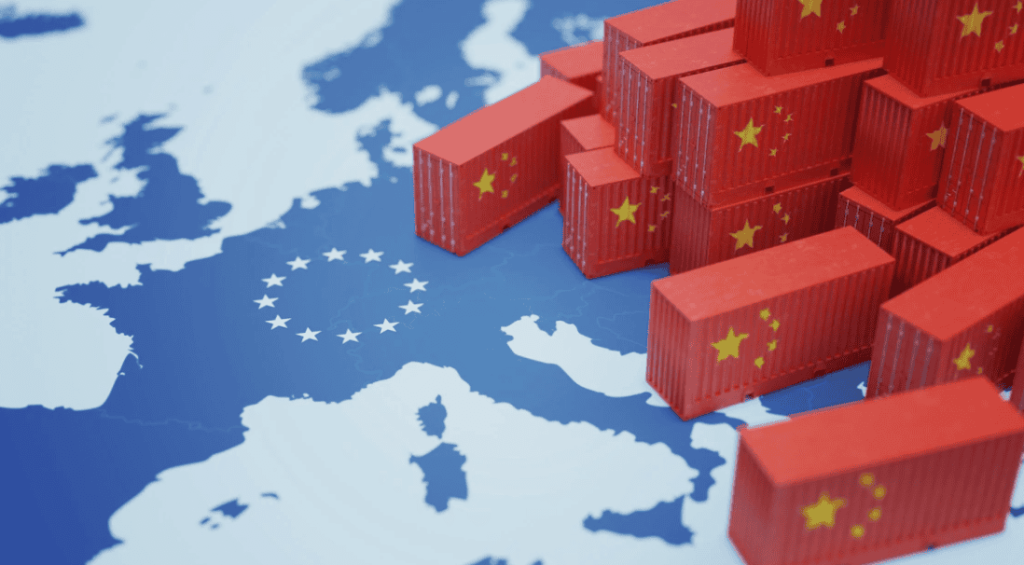
Tariffs affect both supply and demand, possibly with contrasting effects on prices. This column shows that renewed US-China tensions could redirect Chinese exports to the euro area, boosting supply and lowering prices. Using detailed trade and inflation data, it estimates that such diversion could cut core euro area inflation by 0.3 percentage points over two years. The pass-through is strongest for technology and housing goods. The findings highlight how protectionism abroad can bring disinflation to open economies like the euro area.
Sweeping increases in US-imposed trade barriers are likely to have profound implications for trade patterns, the configuration of global value chains, and key macroeconomic aggregates. The trade tensions that escalated during the first Trump administration offer a salient precedent: they led to heightened global uncertainty and a marked slowdown in investment, even in economies not directly affected by the tariffs. Significant trade diversion occurred as Chinese exports to the US declined, enabling countries such as Vietnam, Mexico, and members of the EU to gain market share (ECB 2025b). 1 Existing empirical evidence also indicates that the tariff pass-through effects primarily harmed US importers and consumers, rather than foreign exporters (Amiti et al. 2020, Feng et al. 2023).
For central banks with an inflation mandate, the priority is assessing their effect on consumer prices. Tariffs affect both supply and demand, possibly with contrasting effects on prices. For countries that impose tariffs, the direct effects resemble a stagflationary shock, as prices rise and demand drops. General equilibrium effects, on the other hand, lead to a slowdown of investment and global trade, and a fall in commodity prices, putting downward pressure on inflation. Higher uncertainty and financial market turbulence may add further disinflationary pressure. Finally, the response of the exchange rate may tip the inflation balance in one or the other direction.
At the current juncture, an additional concern for euro area inflation is that, in response to a loss of access to the US market, Chinese exports could flood European markets, increasing competitive pressure on domestic producers (Panetta 2025, Lagarde 2025). Lower demand for euro area exports as a result of higher tariffs and a re-routing of exports into the euro area from countries with overcapacity would also put downward pressure on inflation (ECB 2025a).
China’s export share in the euro has increased in the past ten years, on the back of rising demand for electronic products and cars. More recently, despite evidence of de-risking from China, the share remains higher than before the first Trump presidency. In 2024, the euro area imported roughly €400 billion worth of manufactured goods from China, accounting for over 20% of total extra-euro area imports (Figure 1a). Since mid-2022, the prices of imports from China have fallen materially. From the end of February to mid-May 2025, downward pressure on import prices intensified further, as the yuan depreciated by almost 10% against the euro (Figure 1b).
The lion’s share of euro area imports from China consists of electrical equipment and machinery (such as batteries, lighting, and household appliances), as well as electronic and data processing goods (including computers, cameras, recorders, televisions, and telecommunications equipment). In these sectors, China is by far the euro area’s largest external supplier, with import shares significantly exceeding those of other main trade partners (Table 1). China also supplies a broad spectrum of low-tech manufactured goods — such as vehicle parts, plastics, clothing, footwear, handbags, toys, and furniture.
Figure 1 Manufactured goods: Imports (billions of euros; left) and unit values (indices, Jan2021=100; right)


Source: authors’ calculations on Eurostat and LSEG/Datastream data.
Notes: The analysis is restricted to manufactured goods, as defined by sections 5 to 8 of the Standard International Trade Classification (SITC), a system developed by the United Nations to classify traded goods; the classification is hierarchical, ranging from broad 1-digit categories to detailed 5-digit subcategories. Primary commodities such as food, raw materials, and energy products are not included (sections 0,1,2,3,4 and 9). The EUR to CNY exchange rate is reported at weekly frequency: a fall of the index indicates an appreciation of the EUR.
Table 1 Composition of euro area imports of manufactured goods from China


Source: authors’ calculations on Eurostat data.
Note: The analysis is restricted to manufactured goods, as defined by sections 5 to 8 of the Standard International Trade Classification (SITC) Standard International Trade Classification (SITC). Primary commodities such as food, raw materials, and energy products are not included (sections 0,1,2,3,4 and 9). Among manufactured goods, the table excludes chemicals and machinery for industrial purposes.
The impact of higher import penetration from China on euro area consumer prices can be assessed by combining (1) estimates of the import shock, (2) estimates of the elasticities of import prices to trade volumes, and (3) estimates of the pass-through of import prices to consumer prices.
As for the first step, Bank of Italy estimates (Borin et al. 2025) indicate that the re-direction of Chinese exports could bring additional goods from China worth up to €30 billion (i.e. an increase of around 7.5% of goods supply from China) if tariffs were set at their peak, reached after the escalation of trade tensions following the 2 April announcement.
Second, assuming a short-term unitary price elasticity (in line with findings in Boehm et al. 2023), market clearing requires a fall of import prices from China of about 7.5%.
Third, econometric estimates suggest that 1% drop in the unit value index (UVI) of imported Chinese manufactured goods reduces the prices of non-energy industrial goods (NEIGS) in the euro area by around 0.1% over a two-year horizon (Figure 2).
Figure 2 Aggregate pass-through on NEIGs HICP based on unit values (percent)


Source: authors’ calculations on Eurostat and ECB data.
Notes: The figure shows the impulse response function of HICP NEIGs following a 1% temporary decrease in the unit value index (UVI) of imported Chinese manufactured goods. The responses are estimated using local projection methods, controlling for lagged values of euro area PMI output, oil prices, NEIGs price index, USD-EUR exchange rate, and UVI. Standard errors are robust to heteroskedasticity and autocorrelation, with 68% confidence intervals shown in shaded red. The estimation sample spans the period from January 2002 to December 2024.
This pass-through is very heterogeneous across items, as the response is on average strongest for high-tech (e.g. IT equipment and photographic instruments, for which it reaches peak effects of up to 0.4%) and housing-related goods, while low-tech items (e.g. garments and footwear) show more limited responsiveness (Figure 3).
Putting together these numbers, higher supply of Chinese goods induced by US tariffs would shave around 0.8% off NEIGs prices in the euro area. Considering the weight of these products on the consumer basket (one third of core inflation, and one fourth of headline inflation), this translates into a drag of 0.3% for core HICP and of 0.2% for headline HICP over two years.
Figure 3 Responses of HICP components of NEIGs to a 1% decrease in Chinese import unit values (percent)


Source: authors’ calculations on Eurostat and ECB data.
Notes: The figure shows impulse response functions of HICP components following a 1% temporary decrease in the unit value index (UVI) of imported Chinese manufactured goods. The responses are estimated using local projection methods, controlling for lagged values of euro area PMI output, oil prices, NEIGs price index, USD-EUR exchange rate, and UVI. Standard errors are robust to heteroskedasticity and autocorrelation, with 68% confidence intervals shown in dark blue. The estimation sample spans the period from January 2002 to December 2024.
An important point to stress is that our analysis relies on average unit values, rather than import prices. While unit values have some shortcoming (such as composition effects), they allow us to identify the country of origin. An alternative would be to base the analysis on the pass-through of overall import prices (which we estimate to be at around 0.2) and then rescale it by China’s share in extra-euro area imports (about 20% in 2024), yielding a pass-through on consumer prices from China of roughly 0.05, half of our estimate based on unit values. This discrepancy could reflect indirect effects of China’s export prices through other countries and is indicative of the pivotal role that China plays in global supply chains. In particular, a disaggregated analysis suggests that this is the case in sectors where the share of China is relatively large, like IT goods.
The overall effect of re-routing on euro-area consumer prices presented in this column is an upper bound, as lower tariffs would naturally imply lower excess supply of Chinese goods with a milder impact on prices. For example, if tariffs were to be set at the level agreed on the 12th of May, the increase in imports from China would be significantly milder (+2.5%) and headline HICP would be lower by about 0.1%.
Source : VOXeu


