
The US should start fiscal adjustment as soon as it can if it wants to head off the risk of exploding debt related to Trump’s tax and spending plan.
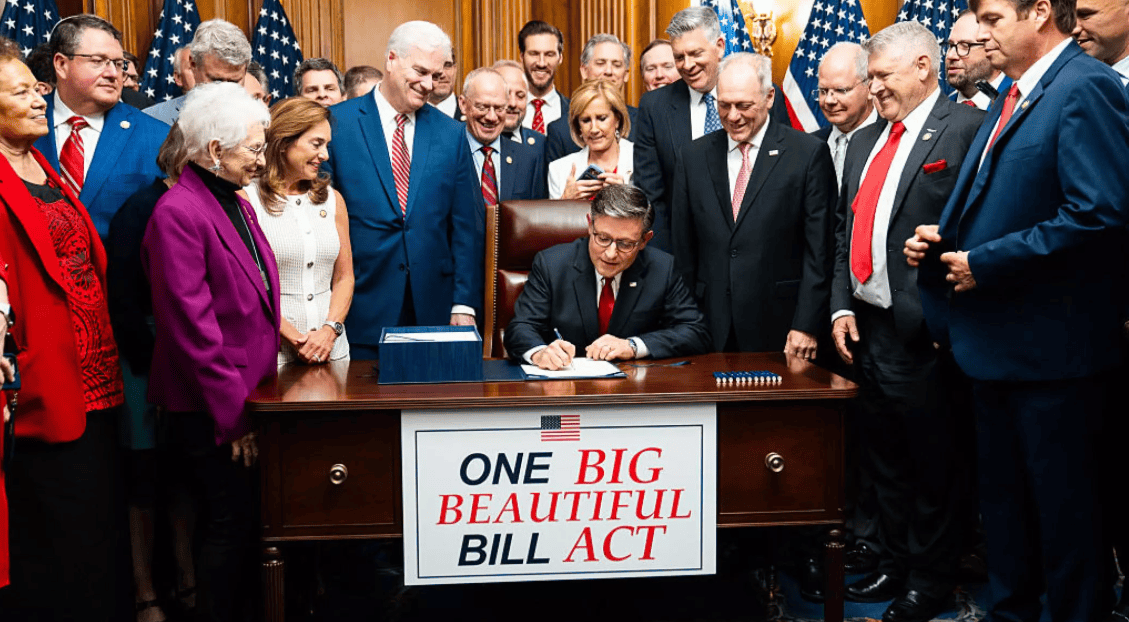
On 4 July 2025, President Donald Trump signed into law the One Big Beautiful Bill Act (OBBBA) . It contains tax and budgetary provisions and is projected by the United States Congressional Budget Office (CBO) to add up to $3 trillion to the national debt within the next decade, or $5 trillion including interest if the act’s measures, many of which are time-limited, become permanent .
US debt already stood at 120 percent of GDP in 2024 . US Federal Reserve Chairman Jay Powell has expressed the concern that “the level of the debt is sustainable, but the path is not. We need to address that sooner or later. Sooner is better than later” . His concern is justified. Figure 1 (Panel A) shows that US debt could become unsustainable, with the projected path of US debt under the OBBBA trending upwards with very high probability. However, upward-trending debt paths are not necessarily unsustainable if plausible fiscal adjustments can be made at a later stage to stabilise the trend – the key word being ‘plausible’.
In this analysis, we seek to answer the following question: does the adjustment to the US government’s fiscal stance, which a future administration would need to make to stabilise the OBBBA’s debt path, look feasible? By feasible, we mean avoiding situations in which the needed adjustments require a primary surplus exceeding about 3 percent of GDP. Should such a scenario arise, we would expect a debt crisis to ensue, as there is no historical episode involving surpluses of such size over a prolonged period (Eichengreen and Panizza, 2016).
To answer the question, we assess the magnitude of the primary balance that will be needed to obtain stable debt paths, such as those shown in Figure 1 (Panel B). We also look at how much difference it will make to act sooner rather than later.
Figure 1: Projected US debt paths

Source: Bruegel based on CBO and IMF World Economic Outlook. Note: Panel A illustrates the US debt paths under economic and fiscal projections by the World Economic Outlook before the OBBBA, and the exploding paths under CBO projections for the new budget until 2050. Panel B illustrates that debt is stabilised at an average level of 180 percent of GDP under the future fiscal adjustments analysed in this paper. The fan charts showing the range of possible values, cover the mean, 25th and 75th quantiles. See Appendix 1.
Given the heightened political uncertainty surrounding US tariffs, the OBBBA and US relations with allies and adversaries alike, we factor political risk into our analysis. Political risk amplifies economic vulnerabilities and makes it harder to keep debt under control (Ajovalasit et al, 2025). US political risk has spiked: during the first quarter of 2025, the International Country Risk Guide (see Appendix 2) score for the US dropped from its historical average of 83 to 76, or by two and a half standard deviations. Such deviations are substantial and can have noticeable adverse effects on a country’s growth and government bond yields (Ajovalasit et al, 2025).
As a baseline for our assessment, we use April 2025 IMF World Economic Outlook (WEO) projections for nominal GDP and primary balance, with political-risk effects. In terms of political risk, we show the outcomes depending on whether US risk returns to its historical low level or remains at its current high level (Table 1). We also factor in the impact of the Fed lowering interest rates, and of potentially lower US growth (Tables 2 and 3). For more details of our approach, see Appendix 1.
The big, beautiful debt challenge: sooner rather than later
Table 1A shows the results, assuming fiscal consolidation begins in 2030. Under the WEO projections, a primary surplus of 1.5 percent of GDP is sufficient to stabilise US debt at about 170 percent of GDP, increasing to 2 percent and 185 percent, respectively, when accounting for political risk at historical low levels 5 . When the OBBBA is factored in ‘as written’, with temporary tax cuts and spending provisions phased out to schedule, the required primary balance would increase to 1.6 percent of GDP to stabilise debt at 180 percent, jumping to 2.5 percent and 240 percent respectively if the present high level of political risk persists. If OBBBA measures are made permanent, and with high political risk, the stabilising primary surplus would need to reach 2.6 percent. Compared to a threshold of 3 percent, our baseline estimate is thus that debt stabilisation is feasible, albeit challenging.
If fiscal consolidation is delayed until 2035, the situation would worsen significantly (Table 1B). Assuming the OBBBA ‘as written’, and with the high political risk that comes with it, the debt-stabilising surplus would need to increase to 2.75 percent with a debt ratio of 275 percent. Under permanent OBBBA measures, the required primary balance would reach a prohibitively large 3.25 percent, with debt at 280 percent of GDP.
Table 1: Debt stabilising primary balance and debt ratios, projections
A. With fiscal adjustments starting from 2030
| Primary balance(% of GDP) | Stock of debt(% of GDP) | |||||
| Budget projections | Baseline | Low pol. risk | High pol. Risk | Baseline | Low pol. risk | High pol. risk |
| WEO | 1.5 | 2 | — | 170 | 185 | — |
| OBBBA as written | 1.6 | — | 2.5 | 180 | — | 240 |
| OBBBA permanent | 1.75 | — | 2.6 | 180 | — | 240 |
B. With fiscal adjustments starting from 2035
| WEO | 1.75 | 2 | — | 188 | 210 | — |
| OBBBA as written | 2 | — | 2.75 | 200 | — | 275 |
| OBBBA permanent | 2 | — | 3.25 | 215 | — | 280 |
Source: Bruegel.
These tests indicate that a future US administration will need to make considerable fiscal efforts to stabilise the elevated debt levels resulting from the OBBBA’s provisions. Delayed adjustment and elevated political risk would worsen the problem. Most worrying is that if high political risk is assumed, the US administration must reach a primary surplus of 3.25 percent if adjustments are delayed until 2035. In this scenario, a debt crisis would appear unavoidable.
The President’s or the Fed’s interest rates?
On 30 June 2025, President Trump sent a handwritten note to Federal Reserve Chairman Powell, indicating where interest rates “should be” – below 1.75 percent according to Trump, compared to 4.25 percent currently 6 . We analyse a scenario in which the target interest rate averages about 2 percent (see the figure in Appendix 2) to shed light on its effects on debt sustainability. We note, however, that debt sustainability is not part of the Fed’s mandate and our analysis does not consider the potential impact of lower interest rates on inflation, which would change the overall picture.
Table 2 shows the results for the WEO baseline, OBBBA ‘as written’ and with measures made permanent, with political risk taken into account. In all cases, a primary deficit of -0.75 percent of GDP can stabilise debt. This is in sharp contrast to the primary surpluses of up to 3.25 percent of GDP required under the current high rates. Long-term debt ratios are also lower. This analysis shows that with lower interest rates, the government can run a stable debt even while running a small primary deficit – in this sense, Trump has a strong rationale for feuding with the Fed. However, even the Fed does not control real interest rates in the long term and could not offset the impact of higher risk premia through easier monetary policy. Furthermore, the Fed’s decisions are based on its mandate relating to inflation and employment, and not on government debt sustainability.
Table 2: Debt stabilising primary balance and debt ratios with low interest rates
| Primary balance(% of GDP) | Stock of debt(% of GDP) | |||||
| Budget projections | Baseline | Low pol. risk | High pol. Risk | Baseline | Low pol. risk | High pol. risk |
| WEO | -0.75 | -0.75 | — | 145 | 170 | — |
| OBBBA as written | -0.75 | — | -0.75 | 155 | — | 215 |
| OBBBA permanent | -0.75 | — | -0.75 | 155 | — | 220 |
Source: Bruegel.
Debt sustainability with lower growth
Finally, we examine the potential adverse growth effect of the ongoing tariff war and how this could affect debt sustainability. We consider a modest reduction of the US growth rate to 3.3 percent, from the WEO 3.95 percent projection used in our previous simulations (see Appendix 1), and factor in adjustments starting from 2035.
The results (Table 3) show a significant worsening of the debt dynamics and that debt stabilisation would become very challenging. In both the ‘as written’ and ‘permanent’ OBBBA scenarios, the stabilising primary balance would increase to 3.25 percent of GDP if political risk is not included. With political risk, it would rise to a staggering 5 percent. The OBBBA amplifies fiscal vulnerabilities in a low-growth environment.
Table 3: Debt stabilising primary balance and debt ratios if average growth is 3.3%
| Primary balance(% of GDP) | Stock of debt(% of GDP) | |||||
| Budget projections | Baseline | Low pol. risk | High pol. Risk | Baseline | Low pol. risk | High pol. risk |
| WEO | 3 | 3 | — | 200 | 230 | — |
| OBBBA as written | 3.25 | — | 4.5 | 210 | — | 285 |
| OBBBA permanent | 3.25 | — | 5.0 | 225 | — | 300 |
Source: Bruegel.
Conclusion
The OBBBA presents a clear danger to long-term US debt sustainability, though much will depend on whether future adjustments are made to bring debt back towards a sustainable trajectory. Such adjustments are still feasible but challenging, and they had better start sooner rather than later. The current high level of political uncertainty in the US exacerbates the problem.
The analysis also shows that with much lower interest rates than currently, the problem of debt management would be eased significantly. This can explain President Trump’s attacks on the Fed. However, debt sustainability is not part of the Fed’s mandate and the many reasons for the Fed to maintain its independence are well explored in an extensive literature (eg Conti-Brown, 2016; Carstens, 2025). Furthermore, the Fed does not control real interest rates in the long term, and cannot offset the impact of higher risk premia by easing monetary policy.
A slight shortfall in growth compared the WEO projections – which date from before the tariff war – could create an unsolvable problem for US debt sustainability.
Appendix 1: Approach
For our analysis, we proceeded in four steps. First, we conducted a debt sustainability analysis of the OBBBA using the CBO projections under the US yield curve of the last fiscal day of 2024, and estimated future fiscal adjustments that would stabilise debt. Second, we factored in the cost of delaying any necessary adjustments (in the sense of increasing the required adjustment). Third, we evaluated the potential impact of the Fed lowering interest rate, along the lines suggested by President Trump in his attacks on Chairman Powell. Fourth, we assessed the effects of a potential deterioration of growth.
We used as the baseline the World Economic Outlook projections for the US economy with long-term growth projected at 3.95 percent and a primary balance of 1.75 percent per annum. The yield curve we use on the US government debt averages about 4 percent (Appendix 2). We consider the primary balance of the OBBBA ‘as written’ and focus on ‘permanent’ projections 7 . To start with, we assumed no effects of the OBBBA on growth or interest rates, to focus our analysis on the spending aspects of the bill. For the stochastic debt sustainability analysis (SDSA), we used the scenario tree model of Zenios et al (2021), with the volatilities and correlations of growth, primary balance, yield curves and the political ratings to calibrate the scenario tree given in the table in Appendix 2. The model optimises debt financing over a long horizon with a tail risk constraint on debt refinancing to project debt stock fan charts and their quartiles (Figure 1). This risk horizon is sufficiently long to demonstrate the effects of the OBBBA and assess the ability of future administrations to take corrective action. If the 0.75 quantile is stable, then we consider the debt to be sustainable with high confidence.
To assess whether future adjustments can feasibly stabilise the debt, we ran SDSA and estimated the debt-stabilising primary balance. Specifically, we estimated a linear increase in primary balance starting in 2030 or 2035, reaching a steady state within seven years. In all tests, we report the steady-state primary balance that stabilises the 75th percentile of the debt ratio by 2050.
Appendix 2: data
US government debt data is sourced from FactSet, representing a snapshot of general government gross debt at the end of 2024. The debt-to-GDP ratio represents the general government’s gross debt. The general government’s gross debt is divided by the nominal GDP and its value, according to the IMF WEO April 2025 edition, is 120.78 percent of estimated GDP for 2024. The baseline primary balance is from the WEO.
Debt refinancing rates for US government debt are obtained as the 10-year forward rate for the US 10-Year Treasury Bond at the last fiscal day of 2024 (see the red curve in the figure below). We also consider an environment of low refinancing rates derived from the 10-year forward rate from the same source on 27 December 2017, with a long-term rate of about 2 percent, which is in line with the targets communicated by President Trump to the Fed Chairman on 30 June (footnote 6); see the blue curve in the figure below.
Current and low US yield curves
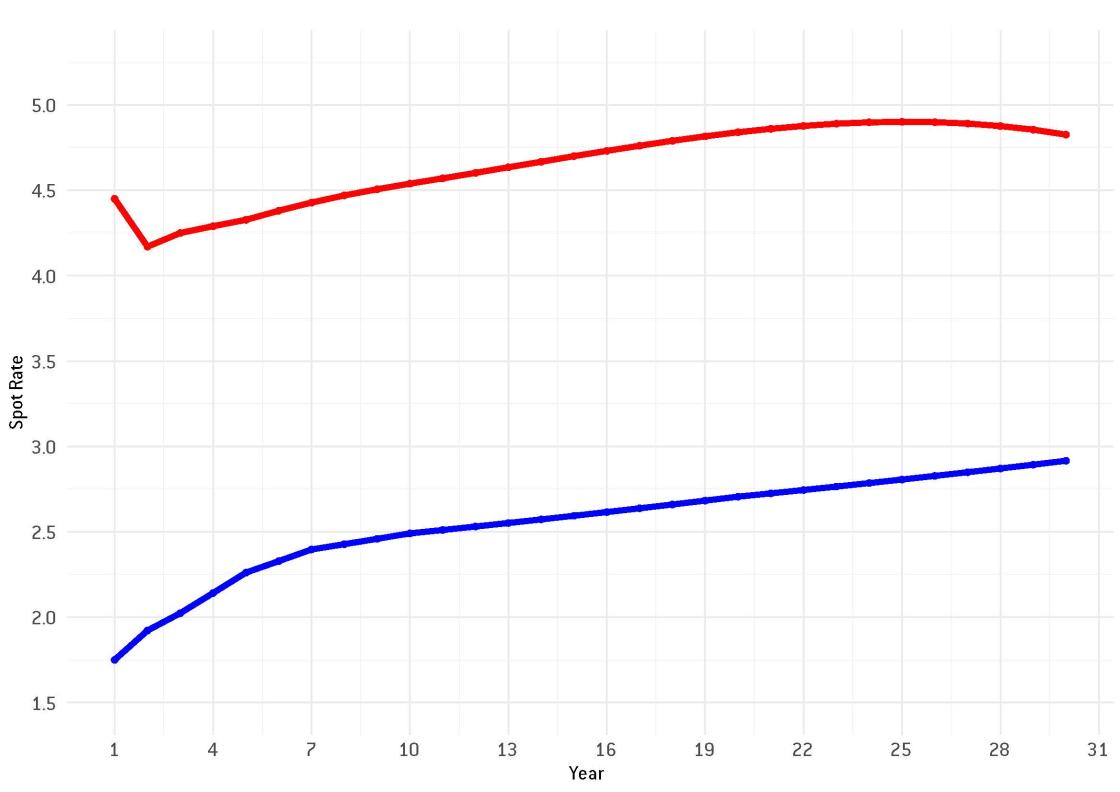
Source: https://fred.stlouisfed.org/.
The International Country Risk Guide (ICRG) scores are from the PRS Group, which provides monthly assessments of political and financial risks. We use monthly ICRG values from the past ten years to calibrate our model. For the high-risk scenario, we assume the risk value observed in May 2025 (76.5) remains constant for the duration of the OBBBA effect, after which it returns to the ten-year average. For the low-risk scenario, we assume the recovery to the average begins in 2030.
The table below displays the correlation structure of the risk factors, along with their respective standard deviations, as employed in calibrating a scenario tree for the debt sustainability analysis.
Volatilities and correlations of the debt determinants
| US 10-Year Treasury | GDP Growth | Primary Balance | ICRG | Std. Dev | |
| US 10-Year Treasury B | 1.00 | 2.83 | |||
| GDP Growth | -0.20 | 1.00 | 3.24 | ||
| Primary Balance | -0.03 | 0.25 | 1.00 | 0.95 | |
| ICRG | 0.33 | 0.20 | -0.16 | 1.00 | 2.54 |
Source: Bruegel.
Source : Bruegel