Surprise inflation impacts households’ balance sheets through several channels. This column presents the three key channels – wealth, income, and consumption – and quantifies them for Spain in 2021 using a new granular dataset. The results show that the wealth and income channels trumped the consumption channel. Middle-aged individuals were largely unaffected by inflation, while older people suffered the most.
The recent global surge in inflation has spurred a new wave of studies casting new light on its redistributive impact on wealth (e.g. Curci et al. 2023, Schnorpfeil et al. 2023). This consequence of inflation, especially when unexpected, has been a concern since at least the early 20th century, as underscored in the above paragraph by Keynes. In this column, we contribute to this debate presenting a new analytical framework and a quantification for the case of Spain using a new granular dataset of bank individual clients.
The theoretical channels through which inflation impacts on households’ balance sheets
In Ferreira et al. (2023), we derive a novel analytical expression decomposing the impact of inflation on individual wealth into three different channels, in the spirit of the sufficient statistics approach of Auclert (2019). To this end, we consider a surprise increase in goods and services’ prices, which is heterogeneous across sectors but does not trigger a response of asset prices or interest rates on impact.
First, the ‘wealth (Fisher) channel’ captures how inflation redistributes real wealth from lenders to borrowers by changing the value of nominal assets and liabilities. 1 The impact of inflation on wealth is fully captured by the net nominal position (NNP), defined as the difference between nominal assets and nominal liabilities.
Second, inflation reduces the real value of nominal income, through what we call the ‘income channel’. Nominal income sources such as wages, pensions, or unemployment benefits are often sticky. Wages in Spain, for instance, are typically updated at annual frequency or even lower than that. While inflation reduces the real income and wealth of all agents in the same proportion relative to their pre-shock levels, the absolute impact will naturally be higher the higher the nominal income is.
Third, inflation does not typically affect all prices homogeneously. The prices of some goods or services rise more than those of others. Given that individuals consume different baskets of goods and services, an increase in prices that is heterogeneously distributed across these goods will impact agents differently. We demonstrate how this ‘relative consumption channel’ is proportional to a person’s consumption expenditure multiplied by the ratio between the individual inflation rate, computed using the basket of each particular individual, and the economy-wide inflation rate, computed using the basket of the average consumer. This connects this channel to the emerging literature on ‘inflation inequality’, which analyses how different individuals experience different inflation rates (e.g. Hobijn and Lagakos 2005, Kaplan and Schulhofer-Wohl 2017, Argente and Lee 2021, Jaravel 2018, 2021). For those agents who consume more of the goods and services that experience the largest price increases – that is, those agents with higher individual inflation rates – this channel will lead to a reduction in their wealth, as they need to devote a larger share of resources to pay for their consumption basket. Conversely, those agents experiencing lower individual inflation rates will enjoy an increase in their wealth, as they need to devote less resources to pay for their consumption.
The experience of Spain in 2021
We quantify these three channels within the context of the 2021 inflation surge in Spain. Three features of this particular episode render it an almost ideal event for our estimation exercise. First, the surge was completely unexpected as evident from different measures of inflation expectations at the end of 2020. Second, even when the sharp increase in inflation was well underway, it was (incorrectly) perceived to be very short-lived. Third, the surge arrived after a long period of very low inflation rates, making it more likely that households, firms, unions, and other agents were, at least during the first phase, still inattentive and facing significant costs and inertia to adjust their behaviour.
For our quantification, we employ a novel proprietary dataset from Banco Bilbao Vizcaya Argentaria SA (BBVA). BBVA is a large global bank with a strong presence in Spain. The dataset includes the universe of bank accounts, with information about deposits and current accounts, as well as mortgages, consumer loans, credit, and pre-paid cards. It also includes the universe of card transactions collected from BBVA cardholders and BBVA-operated point-of-sale in Spain, originally collected in Carvalho et al. (2021), together with other means of payment such as cash, direct debit and transfers, which allows us to account for monthly payments to utilities (electricity, water, gas, and telecommunications). Third, client transactions and balance sheet positions can be observed at a weekly frequency, while the relevant surveys are released with an annual or lower frequency.
Three main results emerge. First, both the wealth and the income channels are, on average, one order of magnitude larger than the relative consumption channel (see Figure 1). This implies that heterogeneity in consumption baskets plays a smaller role than these two ‘traditional’ channels. The reason is that the dispersion in individual inflation rates across the population in 2021 was not large enough to generate significant losses or gains.
Figure 1 Components of unexpected inflation on individual wealth

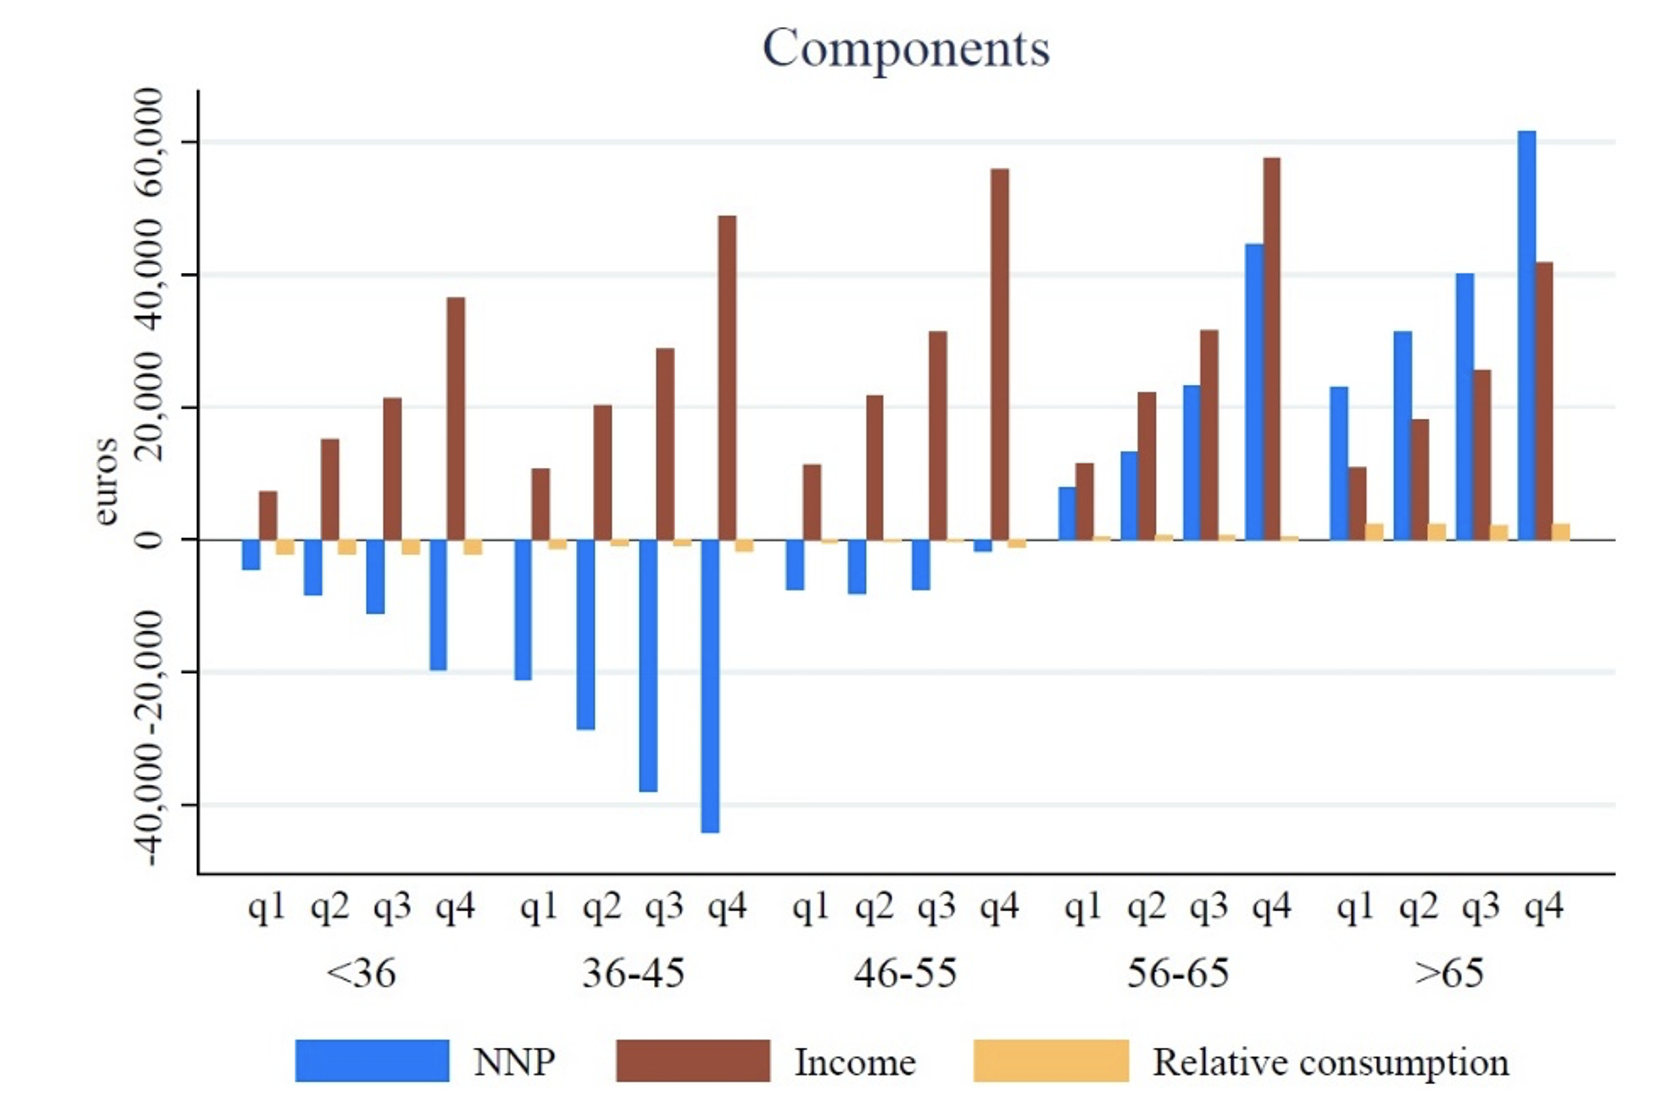
Notes: The figure presents, for each age-income group, the means of the three components, while the bottom panel presents the total effect of unexpected inflation on saving capacity, relative to annual income. These objects are computed as of December 2021. Nominal income and consumption are measured at an annual frequency. Individual inflation levels are the average inflation rate effectively experienced by each age-income group in December 2021, computed using average inflation indices for each ECOICOP category in that month and predetermined consumption baskets as constructed from clients’ transactions in 2021. All quantities are in euros.
Second, the magnitudes of the income and wealth channels are equivalent in absolute value, though the income channel leads to inflation reducing real wealth of all households, whereas the wealth channel increases the real wealth of debtors while reducing that of creditors. The result is that middle-aged individuals, who have large negative NNPs due to mortgages, were roughly unaffected, or even benefited, by the 2021 inflation, while old people experienced the largest decline in real wealth, as they have large positive NNPs (Figure 2).
Figure 2 Total effect of unexpected inflation on individual wealth
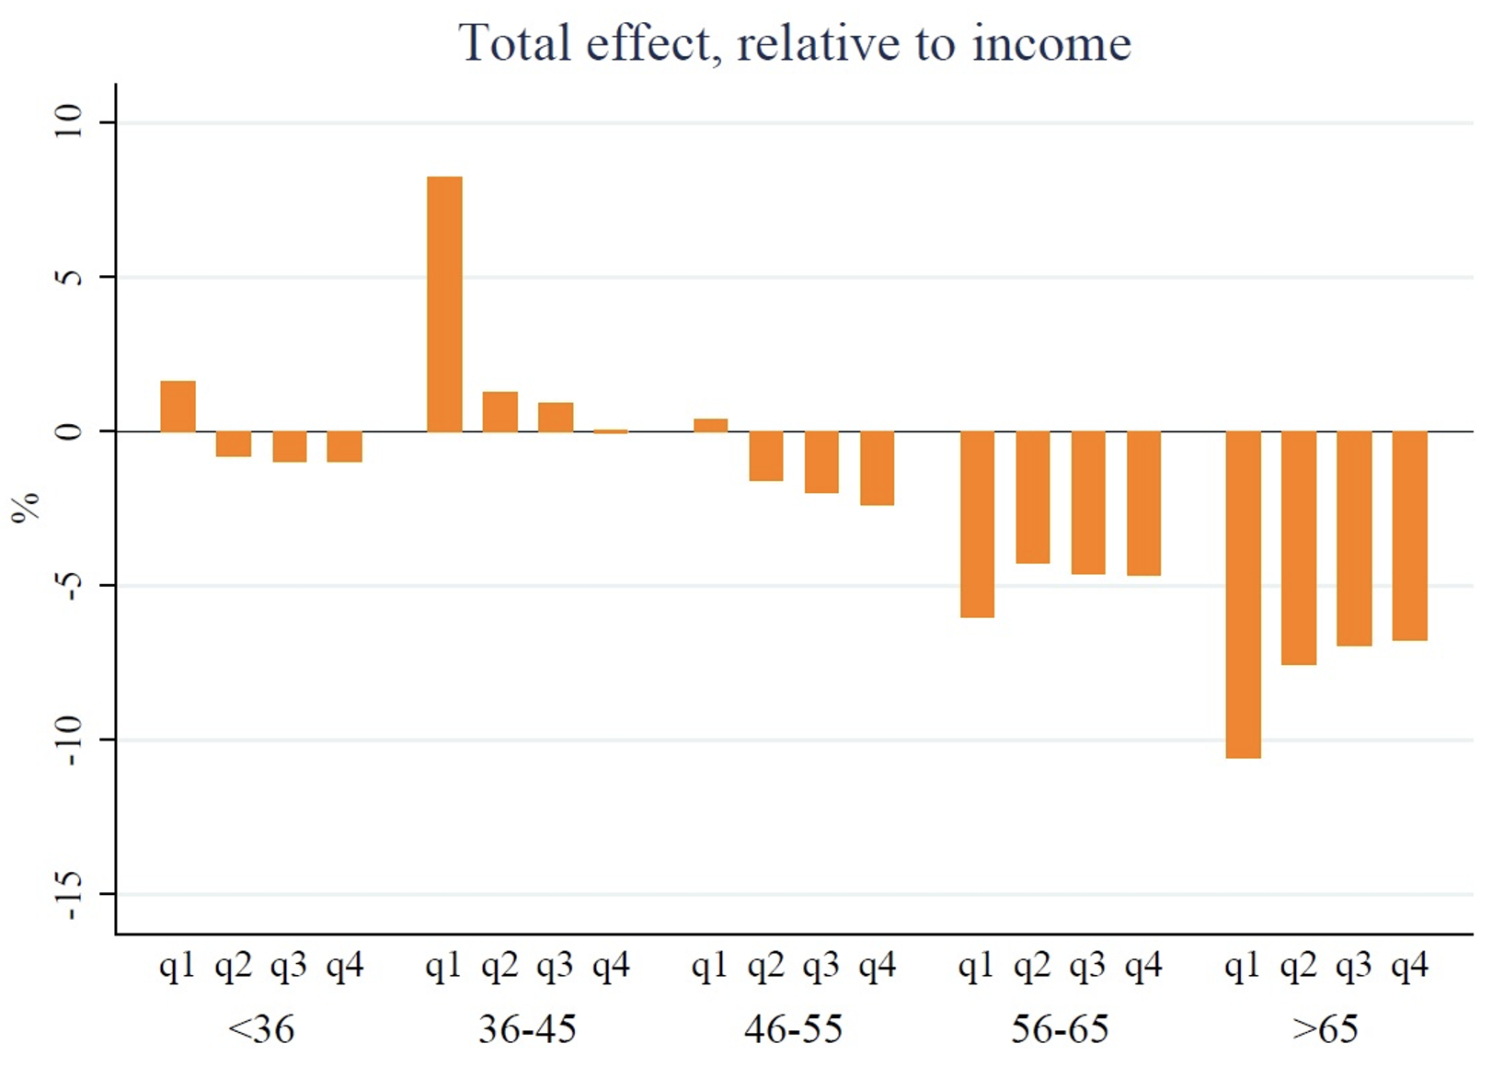

Notes: The figure presents the sum of the three components, expressed in percentage of income.
Reassuringly, these two results are confirmed if we use data from two representative surveys, publicly available, that have been extensively employed both in the policy and research domains: the consumer expenditure survey (the Encuesta de Presupuestos Familiares) and the representative consumer finance survey (the Encuesta Financiera de las Familias).
Third, despite the increase in inflation, we observe no significant change in either NNP or income for different age groups from end-2020 to end-2022. Individual inflation, however, displayed higher variability across age groups in 2022, which suggests that the relative consumption channel may have played a larger role in that year (Figure 3). 2
Figure 3 Dynamics of NNP, income, spending, and individual inflation for middle-aged and older individuals
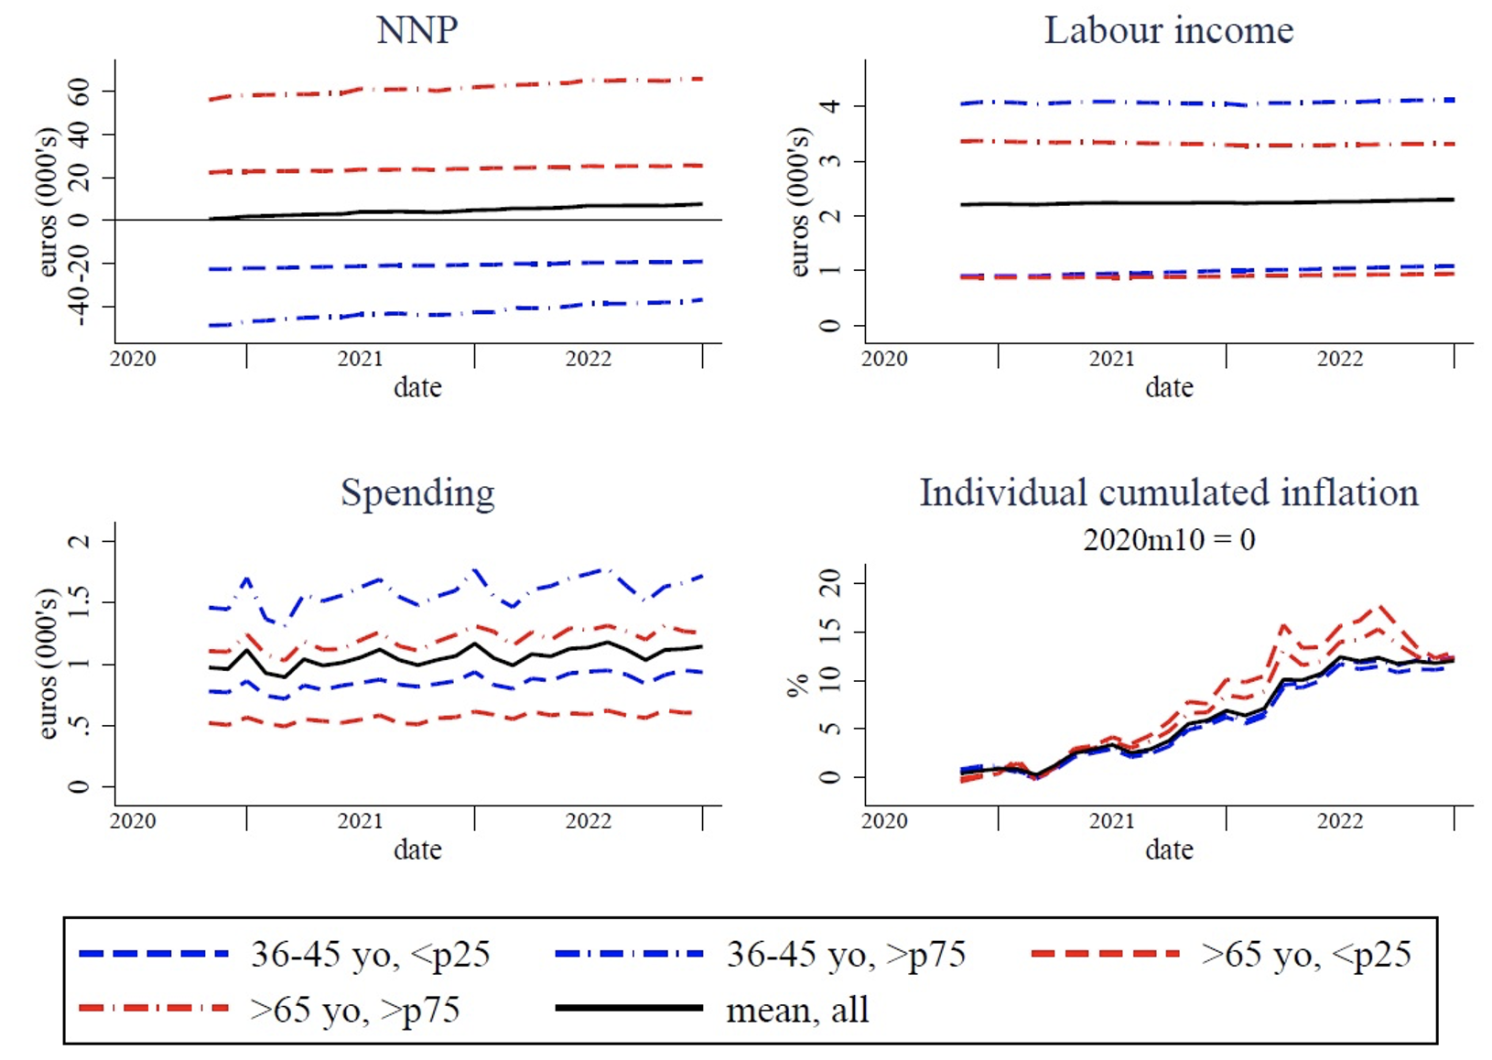

Notes: NNP, income and spending are reported in thousands of euros. Individual inflation is the average inflation rate effectively experienced by each age-income group in each month, computed using average inflation indices for each ECOICOP category and consumption baskets constructed from clients’ transactions in that month.
Concluding remarks
The approach we follow is quite straightforward: it is based on a very general set of assumptions. The IMF, for instance, has employed our analytical framework to analyse the distributive effects of inflation in a broad set of emerging and advanced economies (IMF 2023).
While our approach is appealing as a first answer to this important question, a number of recent works go beyond our simple framework in a number of important dimensions. First, Canto et al. (2023) study welfare changes, rather than wealth inequality, and combine cross-sectional and time series data to estimate the response to identified shocks, which allows them to assess whether different shocks to inflation carry different impacts. Second, Pallotti et al. (2023) measure welfare effects for several countries in the Euro area, while also considering rents, dividends, and capital gains. On top of partial equilibrium effects, they impose further assumptions which allow them to analyze general equilibrium effects. They find that general equilibrium effects are an order of magnitude smaller than partial equilibrium ones. Third, Yang (2023) combines these three channels in a heterogeneous-agent New Keynesian model and analyzes optimal monetary policy.
Source : VOXeu


")


")


.jpeg")


")


")


")


")
")

")