The recent sustained high levels of inflation have increased focus on firm markups and profits. Some broad measures suggest increasing profits, but conflate market and non-market sector dynamics and omit important corporate costs. This column constructs an alternative measure of corporate profits to capture UK firm earnings in excess of all production costs. This measure has been declining since the start of 2022, consistent with evidence from historical energy shocks. This decline has not been uniform across firms, however: firms with higher market power have been better able to increase their margins, while others have experienced large declines.
Energy prices increased sharply in 2022 following Russia’s invasion of Ukraine. Multiple studies have analysed the implications of this shock on firm performance (Gazzani and Ferriani 2022, Fontagné et al. 2023), firm profitability (Kramer et al. 2023), and inflation dynamics (e.g. Hendry et al. 2022, Yotzov et al. 2022). In this column, we focus on firm profitability in the UK, and compare the response of firms during the current energy price shock to historical episodes over the past decades.
Measuring profits is a challenging task (Gutiérrez and Piton 2019): national accounts data are affected by the ‘mixed income’ of self-employed, taxes and subsidies, and conflate two different dynamics: those of the market and non-market (real estate, public) sectors. We focus on the corporate sector and exclude self-employed and non-market sectors. This is similar to the measure used in Haskel (2023), but in contrast to recent IMF and ECB work that focuses on the total economy (see Hansen et al. 2023, Arce et al. 2023). We additionally abstract from the role of taxes and subsidies; as Haskel (2023) points out, these play a large role in the recent period. We thus focus on corporate gross value added (GVA, at factor costs) and initially split this into two components: employee compensations and ‘profits’, or corporate ‘gross operating surplus’ (GOS).
Following Barkai (2020), we can further decompose ‘profits’ into two components:
- Capital compensations, which capture firms’ cost of capital (e.g. the costs of maintaining the equipment and repaying the debt used to purchase it). Following Hall and Jorgensen (1967), we measure these costs as the sum of capital depreciation, changes in replacement costs, and the opportunity cost of holding physical rather than financial capital captured through ten-year government bond yields.
- ‘Excess’ or, as Barkai (2020) calls it, ‘pure’ profits, i.e. what a firm earns in excess of all production costs (including not just labour costs, but also the cost of holding and maintaining the capital input). The share of excess profits in corporate GVA (which captures the price a firm sets relative to its average costs) is the closest concept in national accounts to the measure of markups estimated in firm-level data (which captures the price a firm sets relative to its marginal costs; see also Basu 2019).
Figure 1 presents the trends in the shares of labour and profits in corporate GVA since 2015, and decomposes the profit share further into capital/excess profit shares. The profit share is broadly flat over the period, suggesting the IMF and ECB results reflect in part non-corporate sector dynamics, consistent with the findings in Haskel (2023). When decomposing this share into capital and excess profit parts, we can see excess profits increased in 2021, consistent with markups increasing during the high demand Covid recovery period (Glover et al. 2023). However, they started to decline in 2022, following the onset of the Ukraine war. This fall in excess profits also partly reflects higher capital costs for firms who are now experiencing higher interest payments to service their debt (due to rising interest rates since the start of 2022).
Figure 1 Profit, capital, and excess profit shares, 2015Q1-2023Q1
Percent of corporate gross value-added (GVA) at factor costs
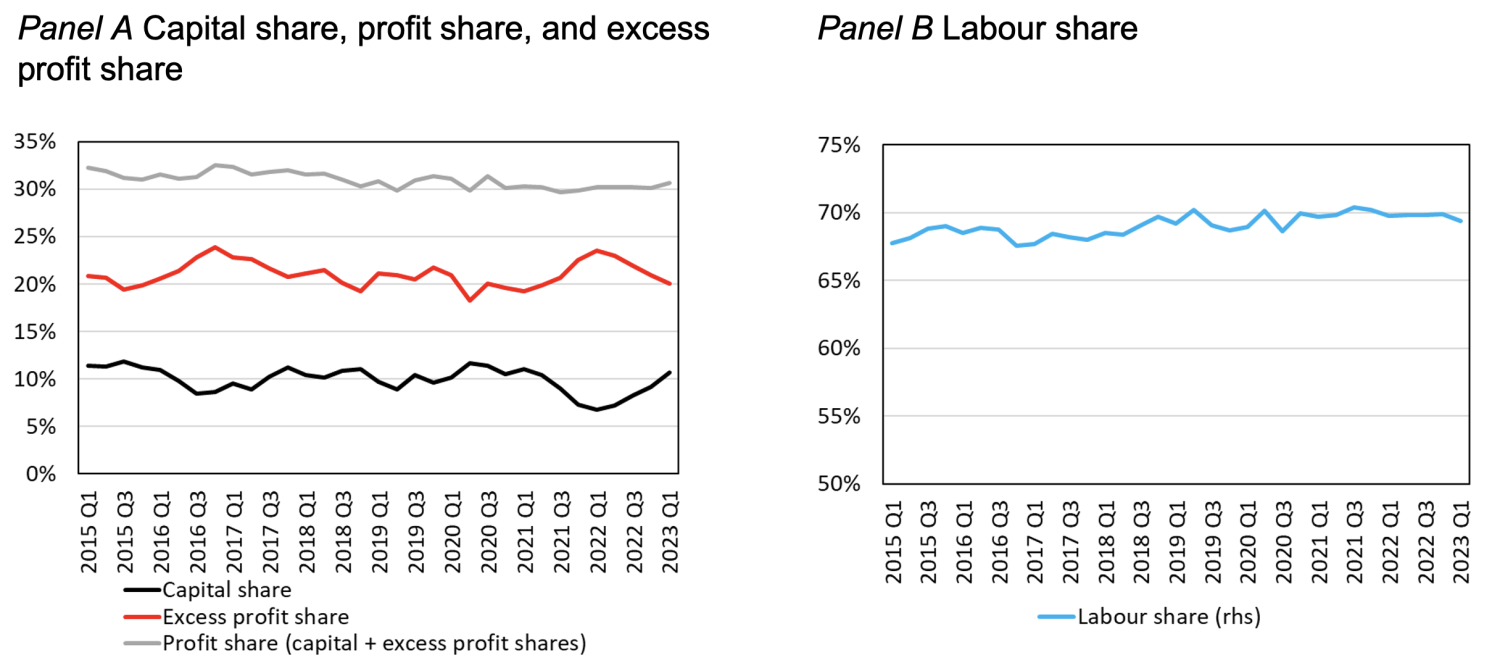
Notes: authors’ calculations using ONS data.
Similarities and differences between current and past energy shocks
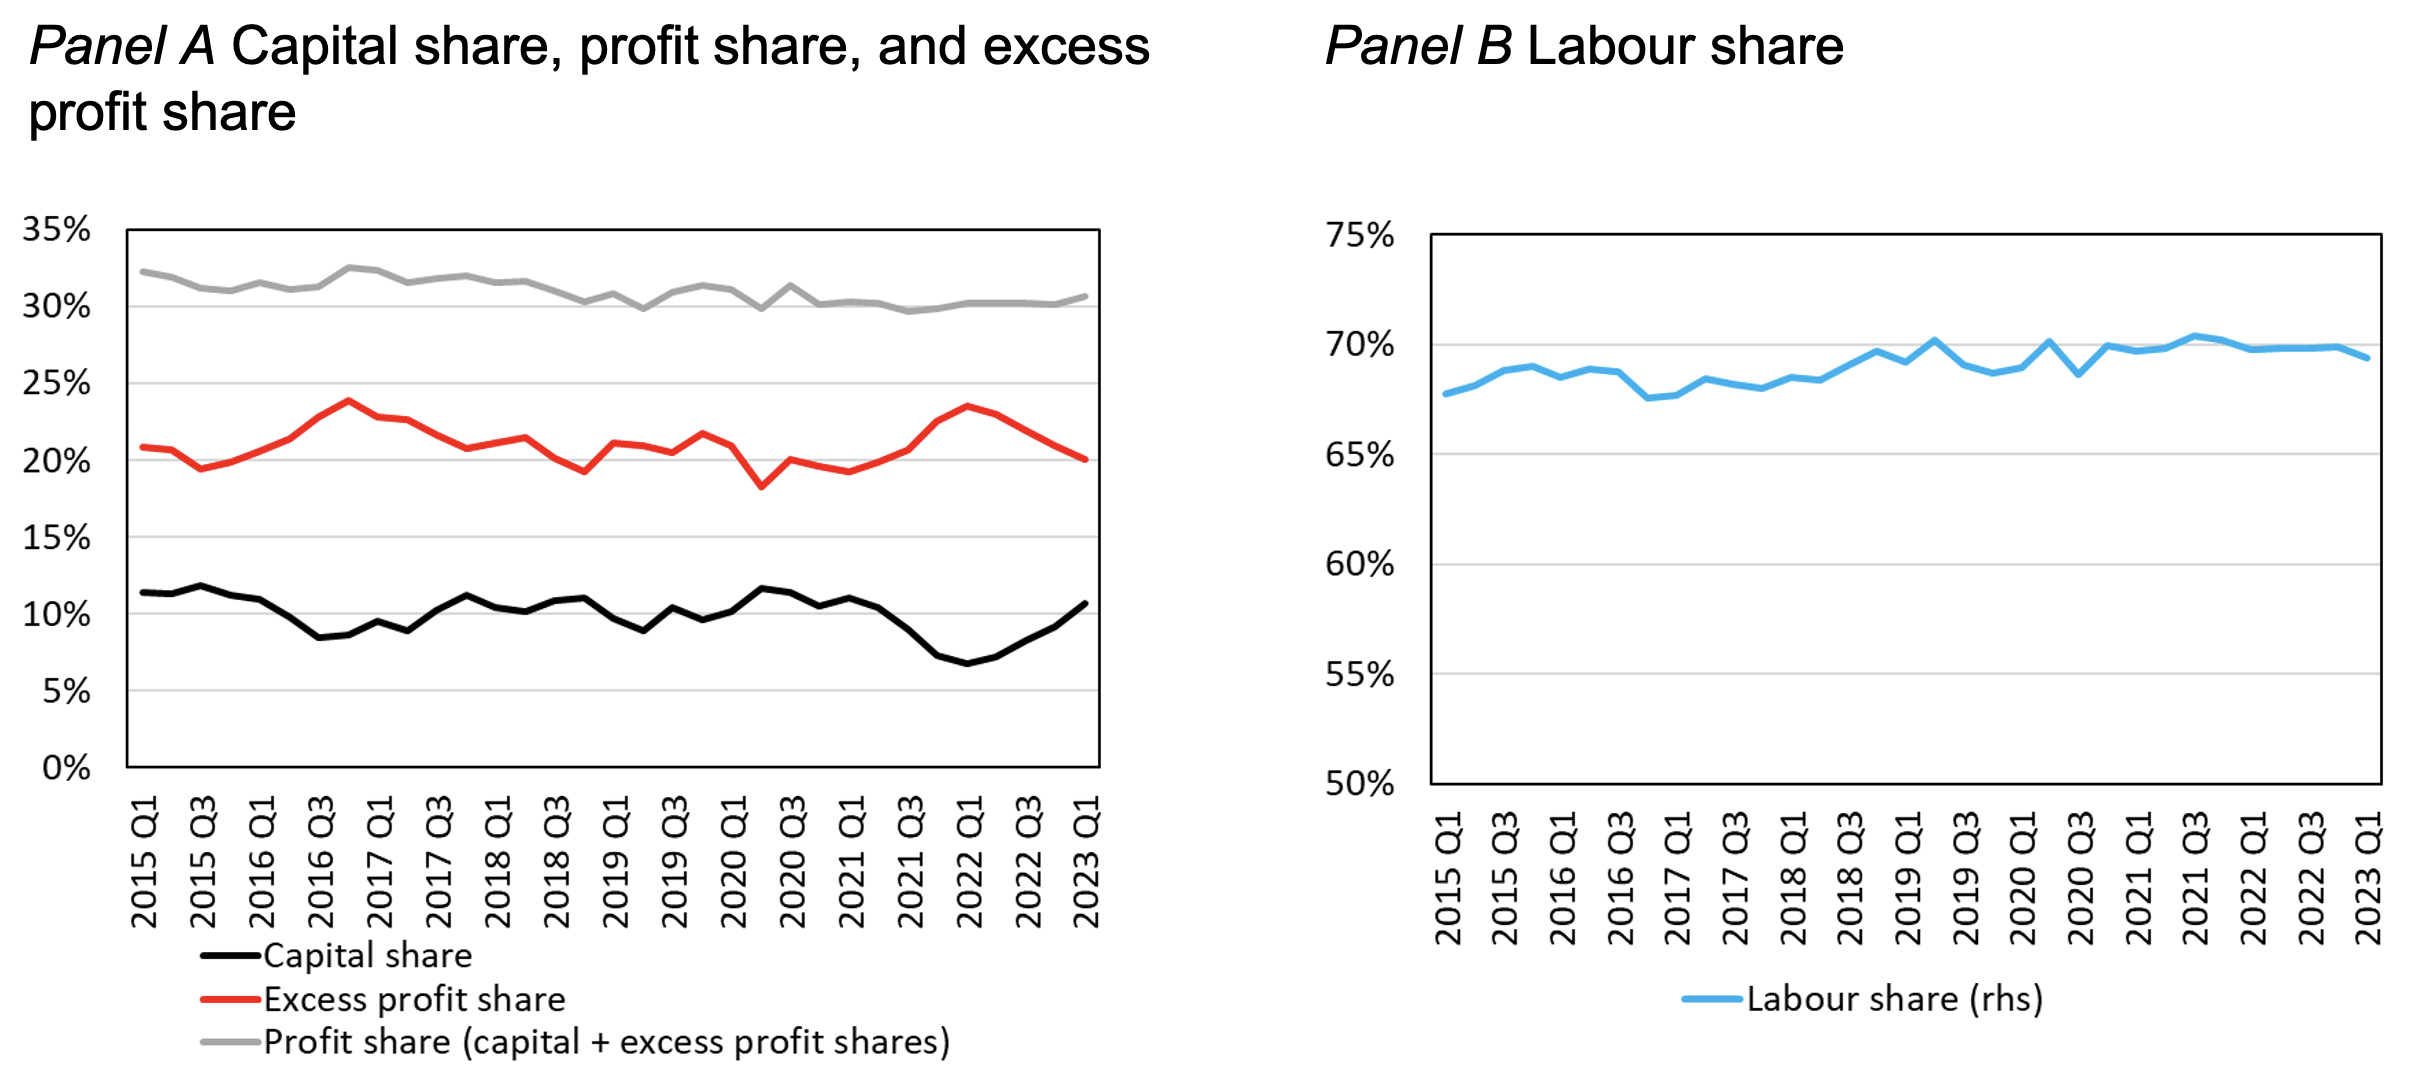
In Figure 2, we compare the evolution of these shares in the 2022 episode to the oil shocks in the 1970s. The labour/profit share response in the 2022 episode is different from the 1970s but similar to more recent energy shocks. In the 1970s, the labour share increased in the first couple of years followed by a decline in the following years. The rise and fall in the labour share was, at the time, thought to reflect the failure of wages to adjust to the adverse supply shocks in the short run (Blanchard 1997). Consistent with this story, this pattern was stronger in countries with more rigid labour markets (Gutiérrez and Piton 2020), such as continental Europe and Japan. Blanchard (1997) also suggests that while the initial effect of the shock was to decrease the profit share, over time firms reacted by moving away from labour, leading to a steady increase in unemployment as well as a recovery, and even an increase, in profit shares. By contrast, the labour share is broadly flat since the start of 2022. This might suggest a different labour market now than in the 1970s, after labour market reforms took place in the 1980s (Muellbauer and Soskice 2022).
Figure 2 Profit, capital, and labour shares around energy price shock episodes
Cumulative changes (in percentage points) from the first quarter of the shock
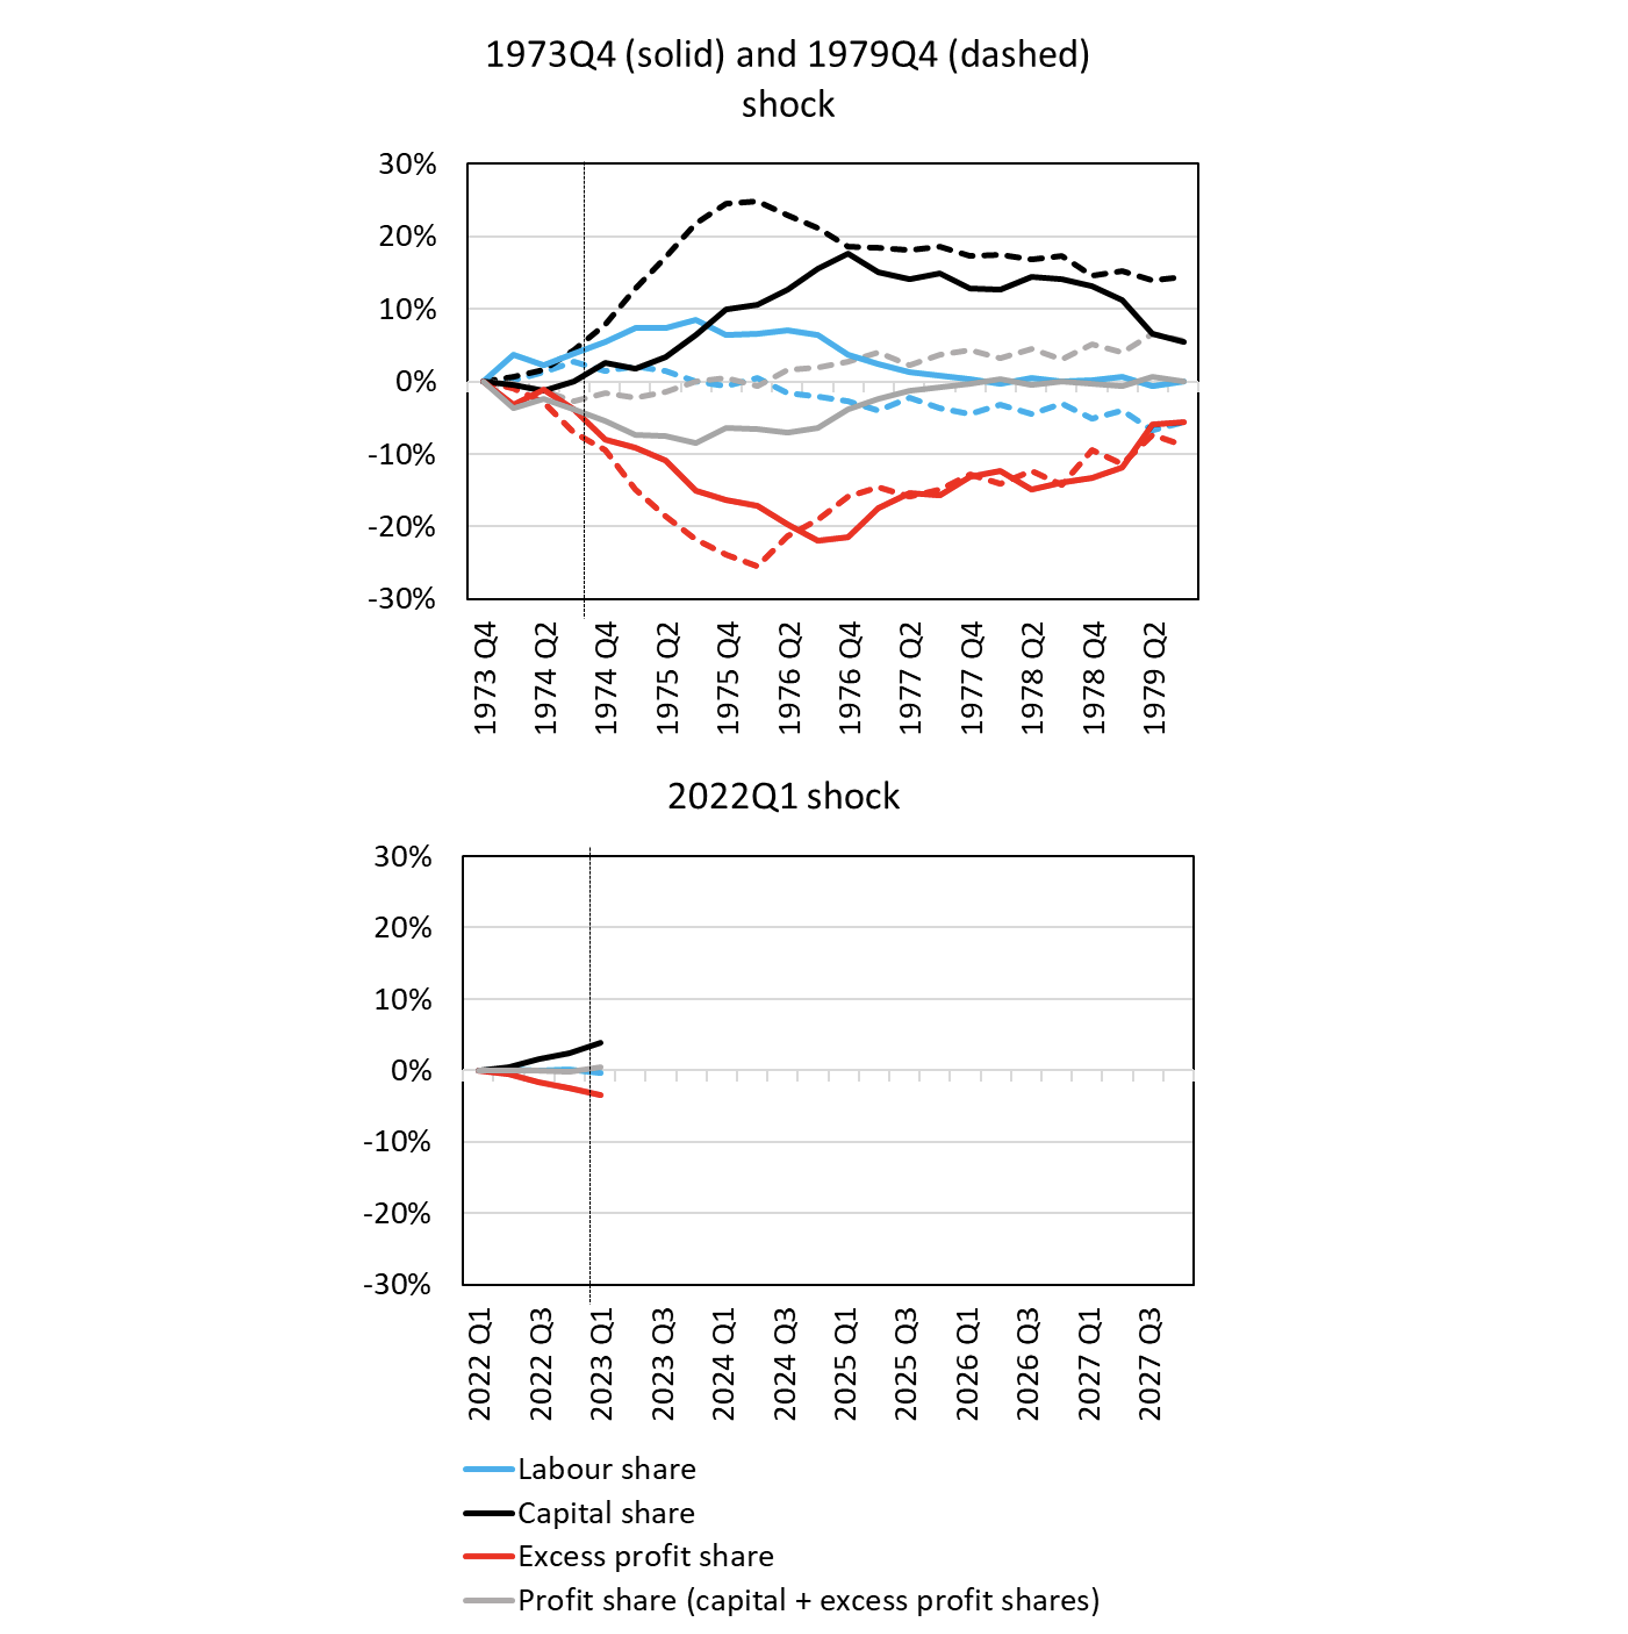
Source: Authors’ calculations using ONS data.
Note: The black vertical line denotes quarter 5 after the shock.
In Figure 3, we formalise the analysis using a local projections framework (Jordà 2005) to estimate the average response of firms’ profits and markups following energy supply shocks over the period 1984-2022. We use the oil-supply news shock series from Kanzig (2021) as our measure of an energy shock, identified via the response of oil-price futures in narrow windows around OPEC+ announcements.
Figure 3, Panel A shows the responses of labour, capital, and excess profit shares to the identified energy shock. The excess profit share (red line) declines by about 0.7 percentage points at the peak following a 10% oil price increase; it suggests a 14 percentage point decline following the 200% price increase observed in 1973. By comparison, we observe a peak decline of 20 percentage point in the excess profit share after the 1973 oil shock (solid red line, Figure 2 top panel), so the responses are of similar magnitude. Over the five quarters 2022Q1-2023Q1, we observe a 3.5 percentage point decline in the share. While the magnitude might seem smaller this time, the shock is also smaller (40% oil price increase), and the government introduced support schemes to soften the impact. Note that the falling excess profit share reflects at least in part the rise in interest rates – an important component of the cost of capital that rises across all episodes (Karabarbounis and Neiman 2018).
Figure 3, Panel B estimates the impact on firm-level markups, which is the closest concept to our measure of excess profits in the national accounts. Markups fall significantly in response to the energy shock with the peak response in year two (by around 0.8 percentage points), where both the magnitude and time-profile of the response is remarkably similar to our findings for the excess profit share (red line in Panel A). Ultimately it is markups that matter for inflation, as inflation is proximately driven by changes in marginal costs and changes in mark-ups (over those marginal costs) desired by firms.
Figure 3 Impulse responses following a 10% increase in oil prices

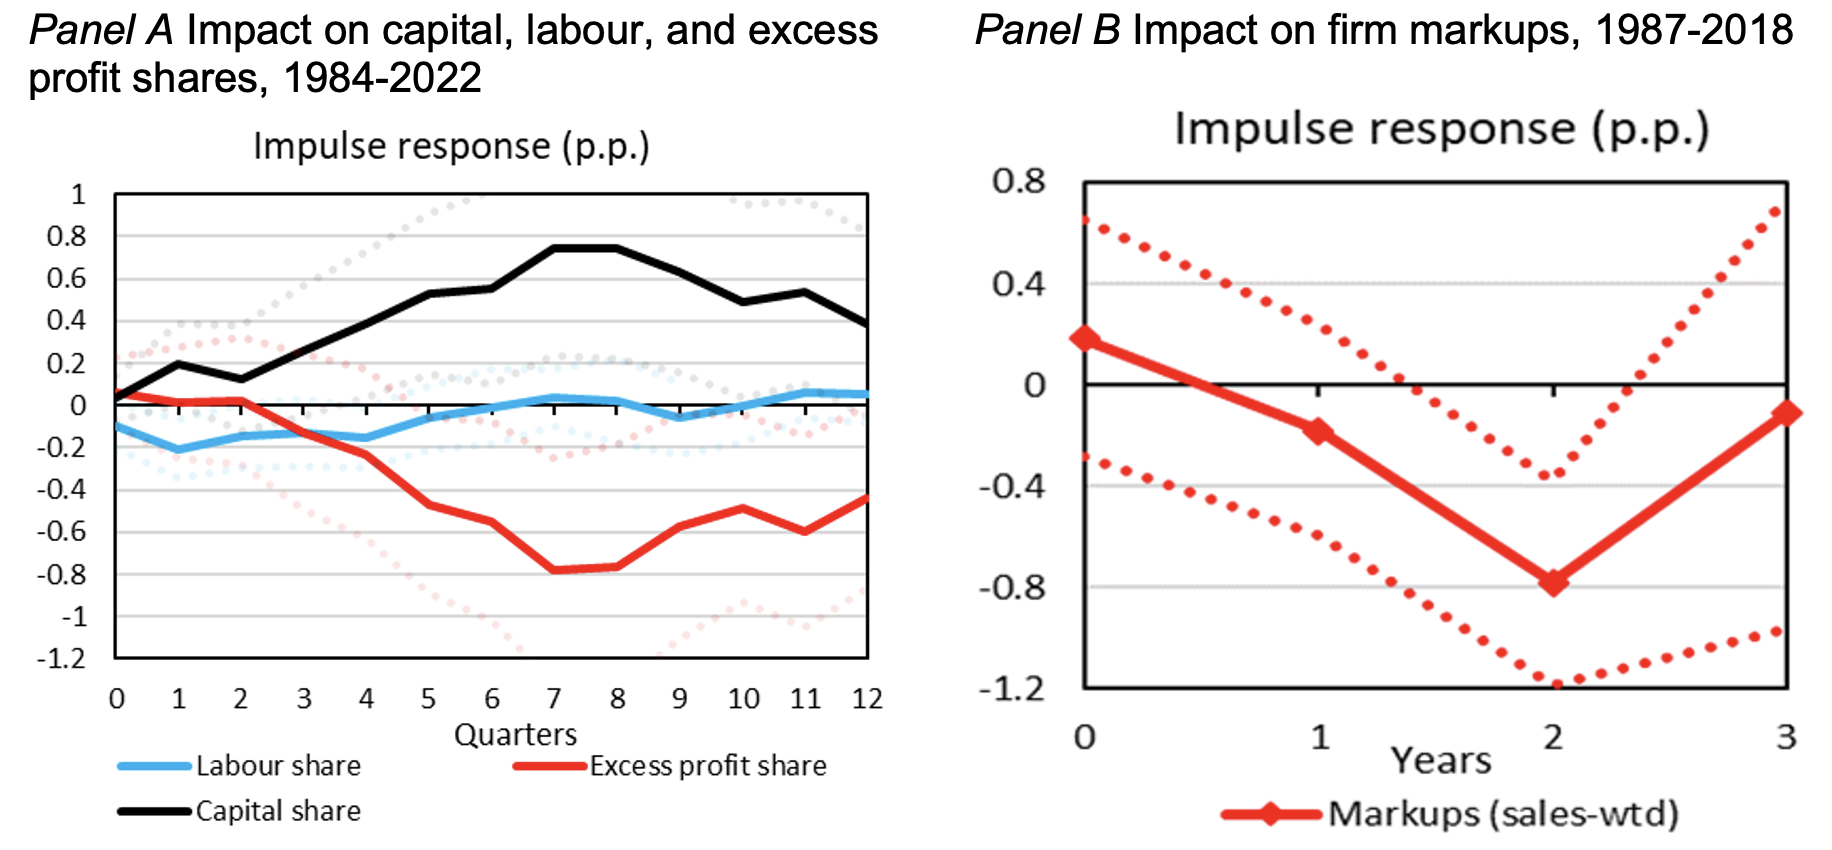
Notes: Estimated impulse responses to energy shocks, using local projections. Results for excess profit, labour and capital shares estimated on quarterly data 1984Q4-2022Q4. Results for markups estimated on annual data over the period 1987-2018 for all UK-listed firms taken from Haldane et al. (2018). Panel B shows the estimated response of average (de-trended) markups, weighted by firms’ UK sales. Dotted lines denote 90% confidence intervals.
Different responses across sectors and firms
The aggregate fall in markups masks significant heterogeneity across sectors: markups rise significantly in the Mining and quarrying sector (driven by oil and gas extraction firms), as well as in some other sectors (e.g. Wholesale and Retail) – see Figure 4. Further analysis using our local projection framework finds that, in the year after the energy shock, markups rise by more (fall by less) for firms that are: (i) in more concentrated industries; (ii) less energy-intensive; and (iii) have less sticky prices.
Figure 4 Estimated response of markups by section-level industry at the one-year horizon
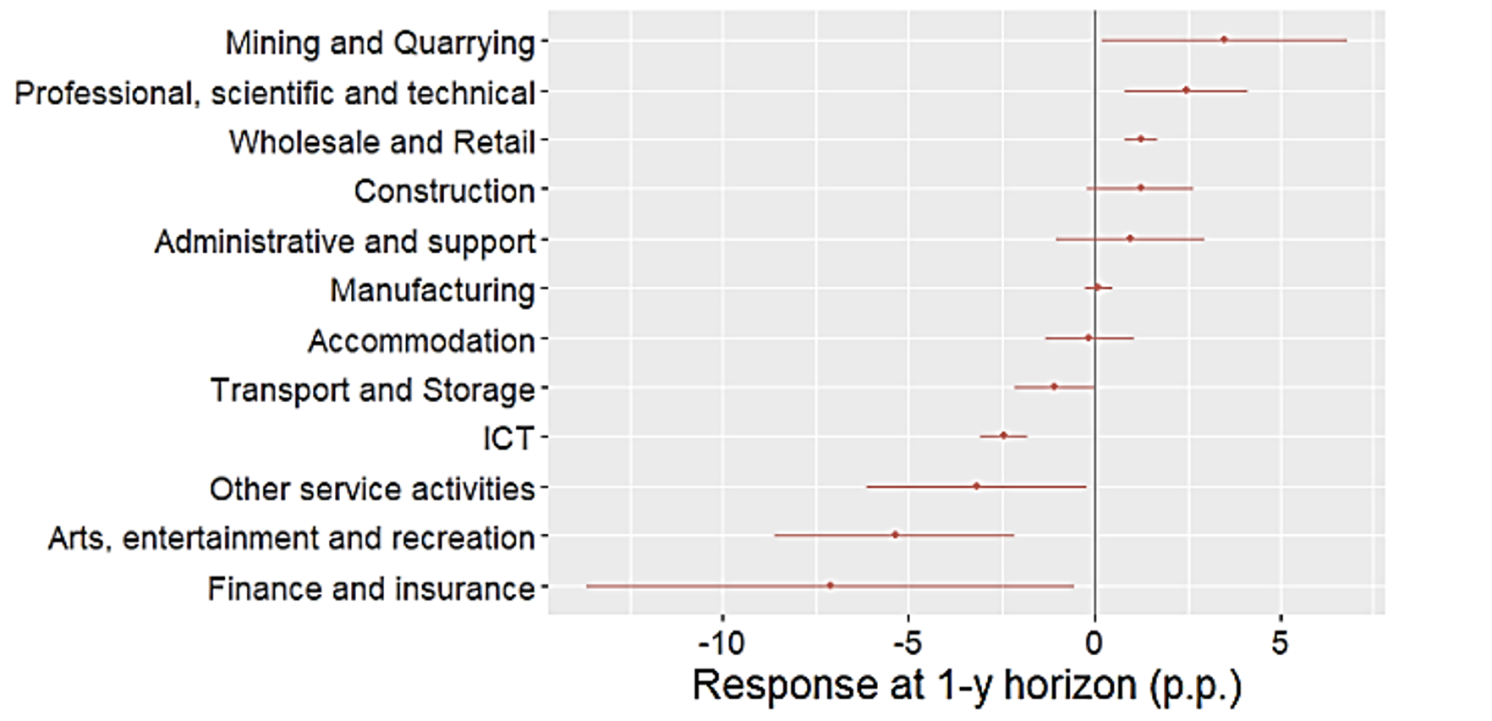

Notes: Dots show estimated response of markups to an energy shock for each industry at the one-year horizon, bands are 90% confidence intervals using Driscoll-Kraay standard errors.
Finally, we use real-time firm-level data from the Decision Maker Panel (DMP) survey to investigate recent changes in firm profitability. In the DMP, we lack the required information to estimate markups. Instead, we focus on net operating profit share in sales (i.e. profit margins). Despite some conceptual differences, this measure is closest to the concept for gross operating surplus share in gross value added (profit share, including both capital and excess profit), and the two measures commove strongly since the mid-1990s.
We investigate how profits evolve for the average DMP firm, and how they depend on firm characteristics. We find that firms in the DMP experienced a small decline in margins since the start of the Ukraine war (red bar in Figure 5). This contrasts with ONS gross profit measure (grey line in Figure 1) that exhibits a flat profit share over 2022-2023. This could be related to the broad sample of firms in the DMP; e.g. there are usually few respondents from the oil sector, where profits tend to increase significantly following an oil shock.
Nevertheless, consistent with the local projections, we see that profits were more negatively affected for firms in high-energy intensive industries, and less negatively affected for firms in more concentrated industries. The DMP also asks about the importance of competitor prices for pricing decisions. Firms that answer that competitors’ pricing is among the most important factor for their price decision usually exhibit a lower decline in margins, but the significance is sensitive to the specification.
Figure 5 Changes in firm profit margins in the Decision Maker Panel conditional on sector/firm characteristics
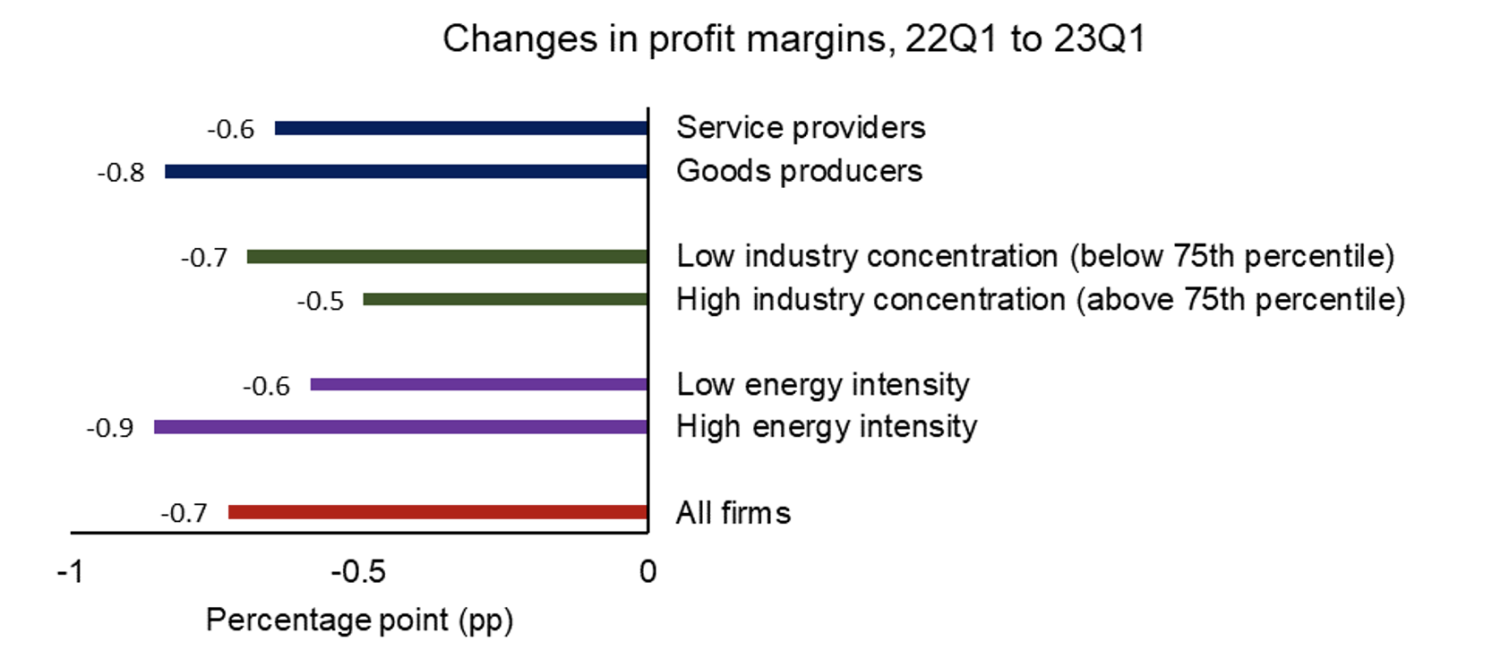

Notes: The results on profit margins are based on the question: ‘In the first quarter of 2023 (January to March), what was your approximate OPERATING PROFIT MARGIN (in percentage terms)? And what was it one year ago, in the first quarter of 2022?’ Energy intensity is estimated using industry data on energy costs from ONS Supply and Use Tables. Industry concentration is measured using a Herfidahl-Hirschman Index at the SIC2 level. The results are weighted by employment and industry shares.
Summing up
This column suggests that firms’ margins have been declining in aggregate since the start of 2022. This is consistent with how they behaved in past energy shocks. However, this decline is smaller for firms in more concentrated industries, suggesting that some firms are better able to use their market power to limit the impact.
Source : VOXeu


")


")


.jpeg")


")


")


")


")
")

")