Industrial policy has gained prominence in public discourse over the last several years as governments seek effective tools and strategies to promote economic development and address new challenges.This column introduces the New Industrial Policy Observatory dataset and documents emergent patterns of policy intervention during 2023. Globally, over 2,500 industrial policy measures have been recorded, out of which 71% are trade distorting. This recent wave of activity is primarily driven by key players, with the US, the EU and China accounting for 48% of the measures. Political economy factors and tit-for-tat dynamics are highly correlated with policy interventions, pointing to the need for careful assessment and multialteral rules on industrial policy.
Industrial policy (IP) has gained prominence in public discourse over the last several years (Figure 1). This renewed interest comes as governments seek effective tools and strategies to promote economic development and address new challenges, from supply chain risks to national security and climate change (Hoekman et al. 2023, Bown, 2023). At the same time, the pursuit of IP by some countries has also raised alarm in others over loss of economic and national security and a vortex of tit-for-tat retaliation, a challenge the multilateral rules-based trading system seems ill equipped to deal with, raising the specter of geoeconomic fragmentation (Aiyar et al. 2023).
Figure 1 Mentions of industrial policy in the major business press

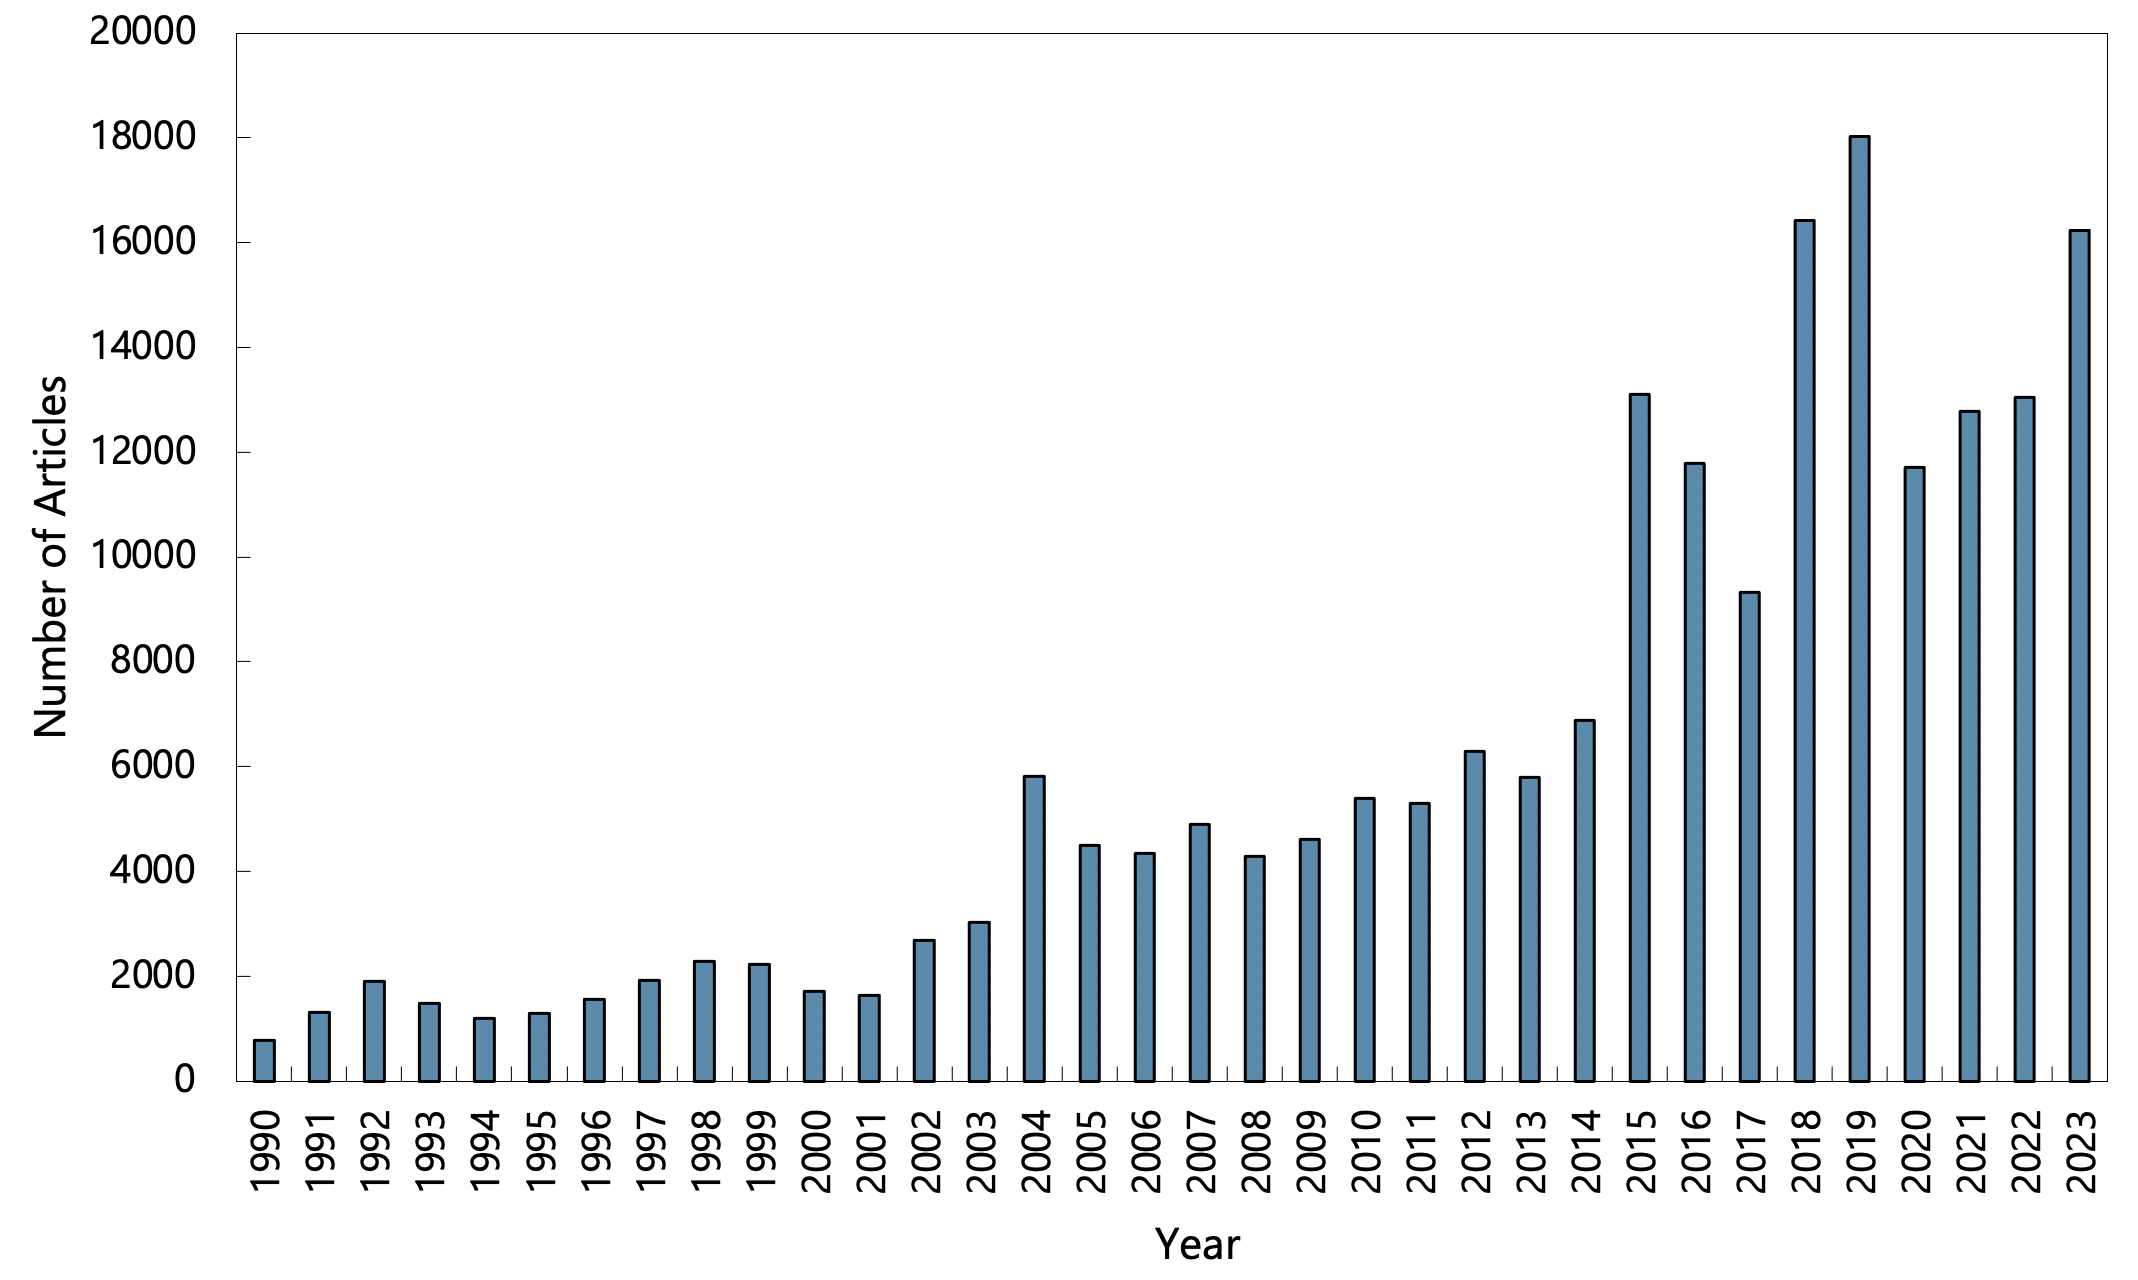
Source: Factiva and authors’ calculations.
While the merits and demerits of IP have long been debated among economists (Pack and Saggi 2006), the lack of high-quality and systematic information on what governments around the world are actually doing is a critical gap in current debates (Juhász et al. 2023). To date, there is no separate inventory of IP measures collected by international organizations or by independent researchers. Some taxonomies have been developed for certain industrial policy interventions, but no sustained effort has been made to move from taxonomy to evidence collection. As a result, to the extent that industrial policy has been assessed empirically, it has been in the context of sectoral or national studies (e.g. Barwick et al. 2023, Lane 2020).
In our recent paper (Evenett et al. 2024), we attempt to fill this data gap by introducing a new monitoring exercise called the New Industrial Policy Observatory (NIPO). We rely on the granular information collected by the Global Trade Alert (GTA) to extract information on new industrial policies (NIPs), by which we mean targeted government intervention aimed at developing or supporting specific domestic firms, industries, or economic activities to achieve national economic or noneconomic (e.g. security, environmental) objectives. 1 This exercise allows to monitor the return of industrial policy, identifying some novel facts, with the aim of enhancing transparency, promoting analysis and informing policy in this area.
Four facts on the return of industrial policy in 2023
Twelve months into the first year of data collection, we have recorded a total of over 2,500 NIPs worldwide, out of which 71% are trade distorting. Collectively, these measures are likely to have significant effects on economic outcomes. For example, the subset of restrictive measures affecting imports for which trade coverage can be precisely identified (a total of 882 measures) impact 22% of global trade – a lower-bound estimate given the data constraints.
Several patterns have already emerged.
- First, IP activity has been concentrated among key economies, with China, European Union, and United States accounting for 48% of the measures. Advanced economies (AEs) have been more active than emerging markets and developing economies (EMDEs) in the use of industrial policy in 2023 and corporate subsidies have been the most common type of trade distorting instrument (Figure 2). 2
Figure 2 New industrial policy in AEs and EMDEs
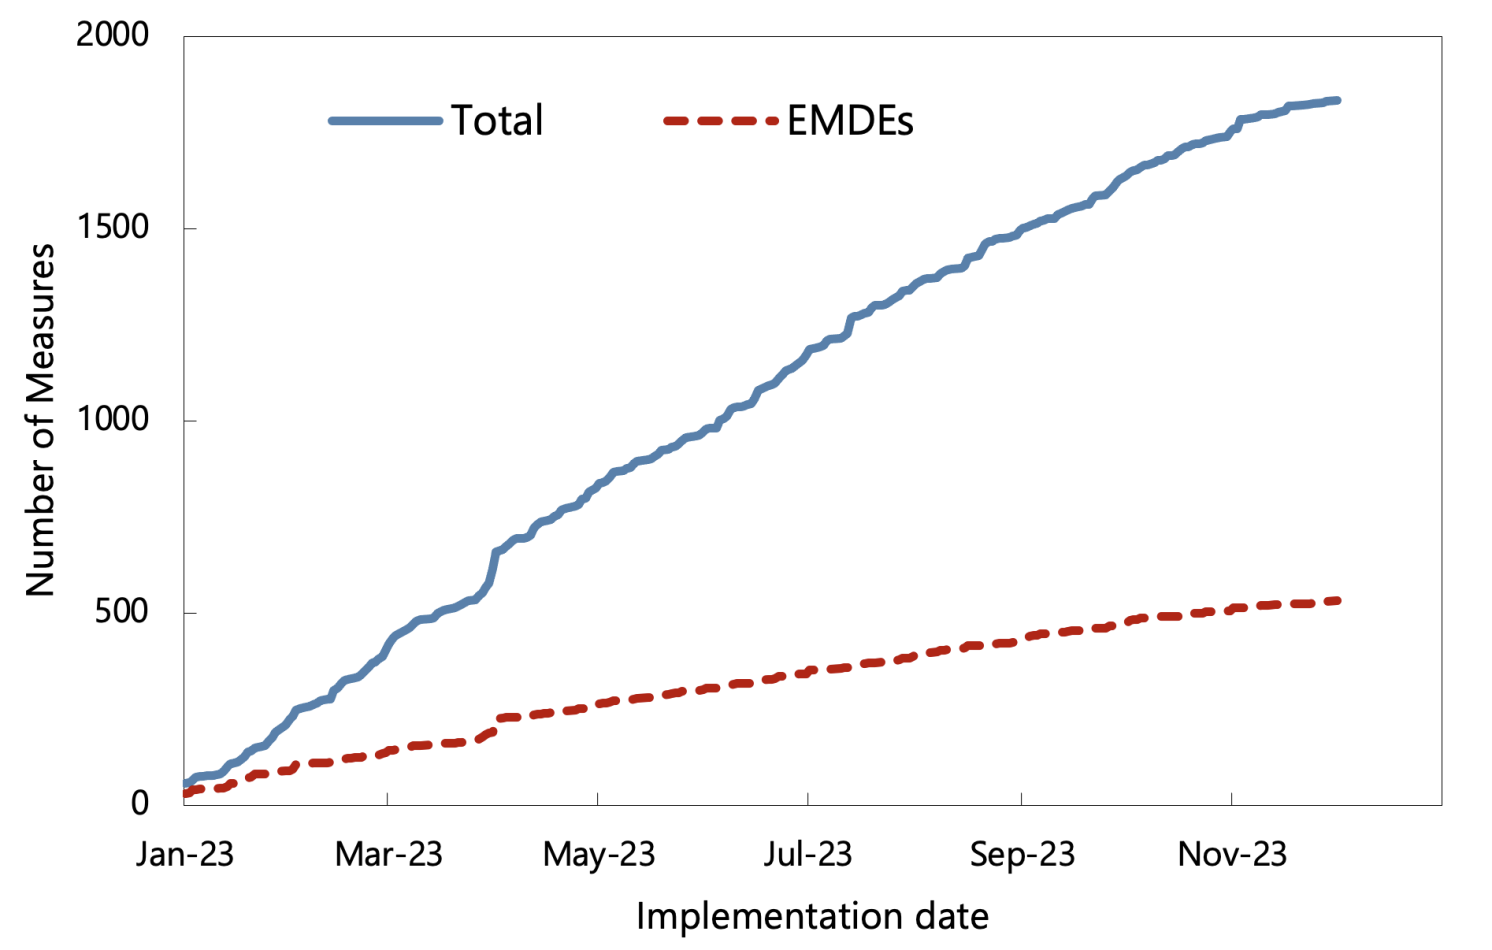

Source: Evenett et al. (2024).
- Second, AEs and EMDEs use different industrial policy instruments (Figure 3). AEs tend to rely on direct financial grants, state loans, and state aid, while EMDEs opt for state loans, tax relief, and capital and equity injections. Trade restrictions on imports and exports are also more frequently used by EMDEs relative to AEs.
Figure 3 Trade distortive industrial policy tools in 2023 by income group

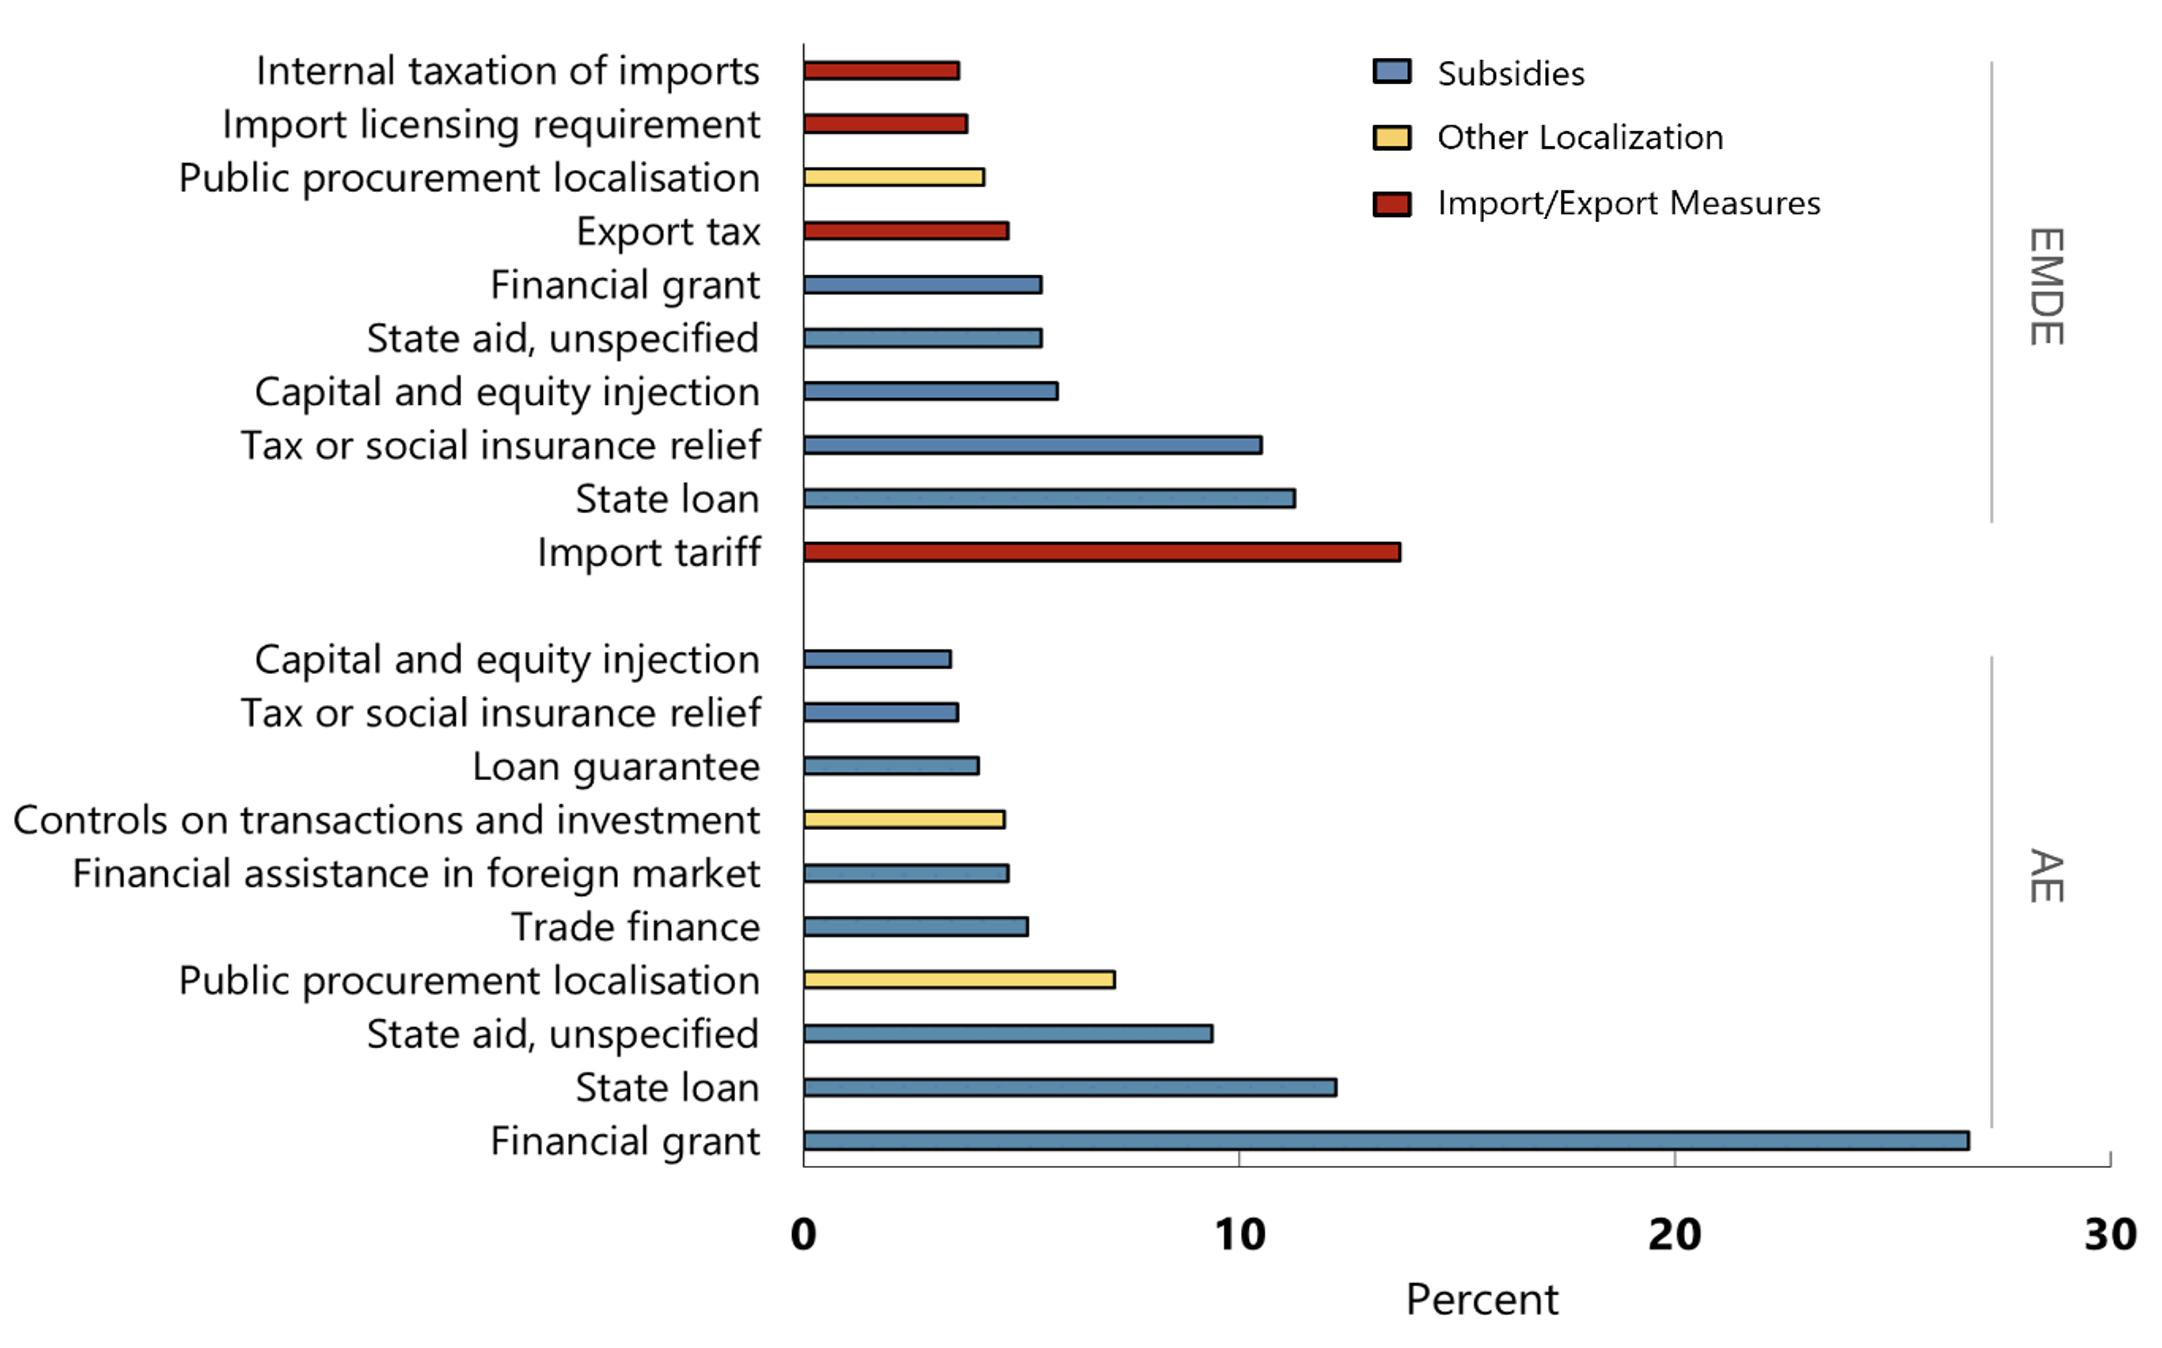
Source: Evenett et al. (2024).
- Third, promoting competitiveness is the dominant motive governments give for taking IP action, but non-economic motives are on the rise (Figure 4). Competitiveness concerns have been the stated objective of governments for over a third of measures where information on motives is available. Motivations related to climate change and supply chain resilience account for 28% and 15%, respectively. National security and geopolitical tensions combined have been the motivation behind around one in five measures.
Figure 4 Trade Distortive industrial policies with stated motivation

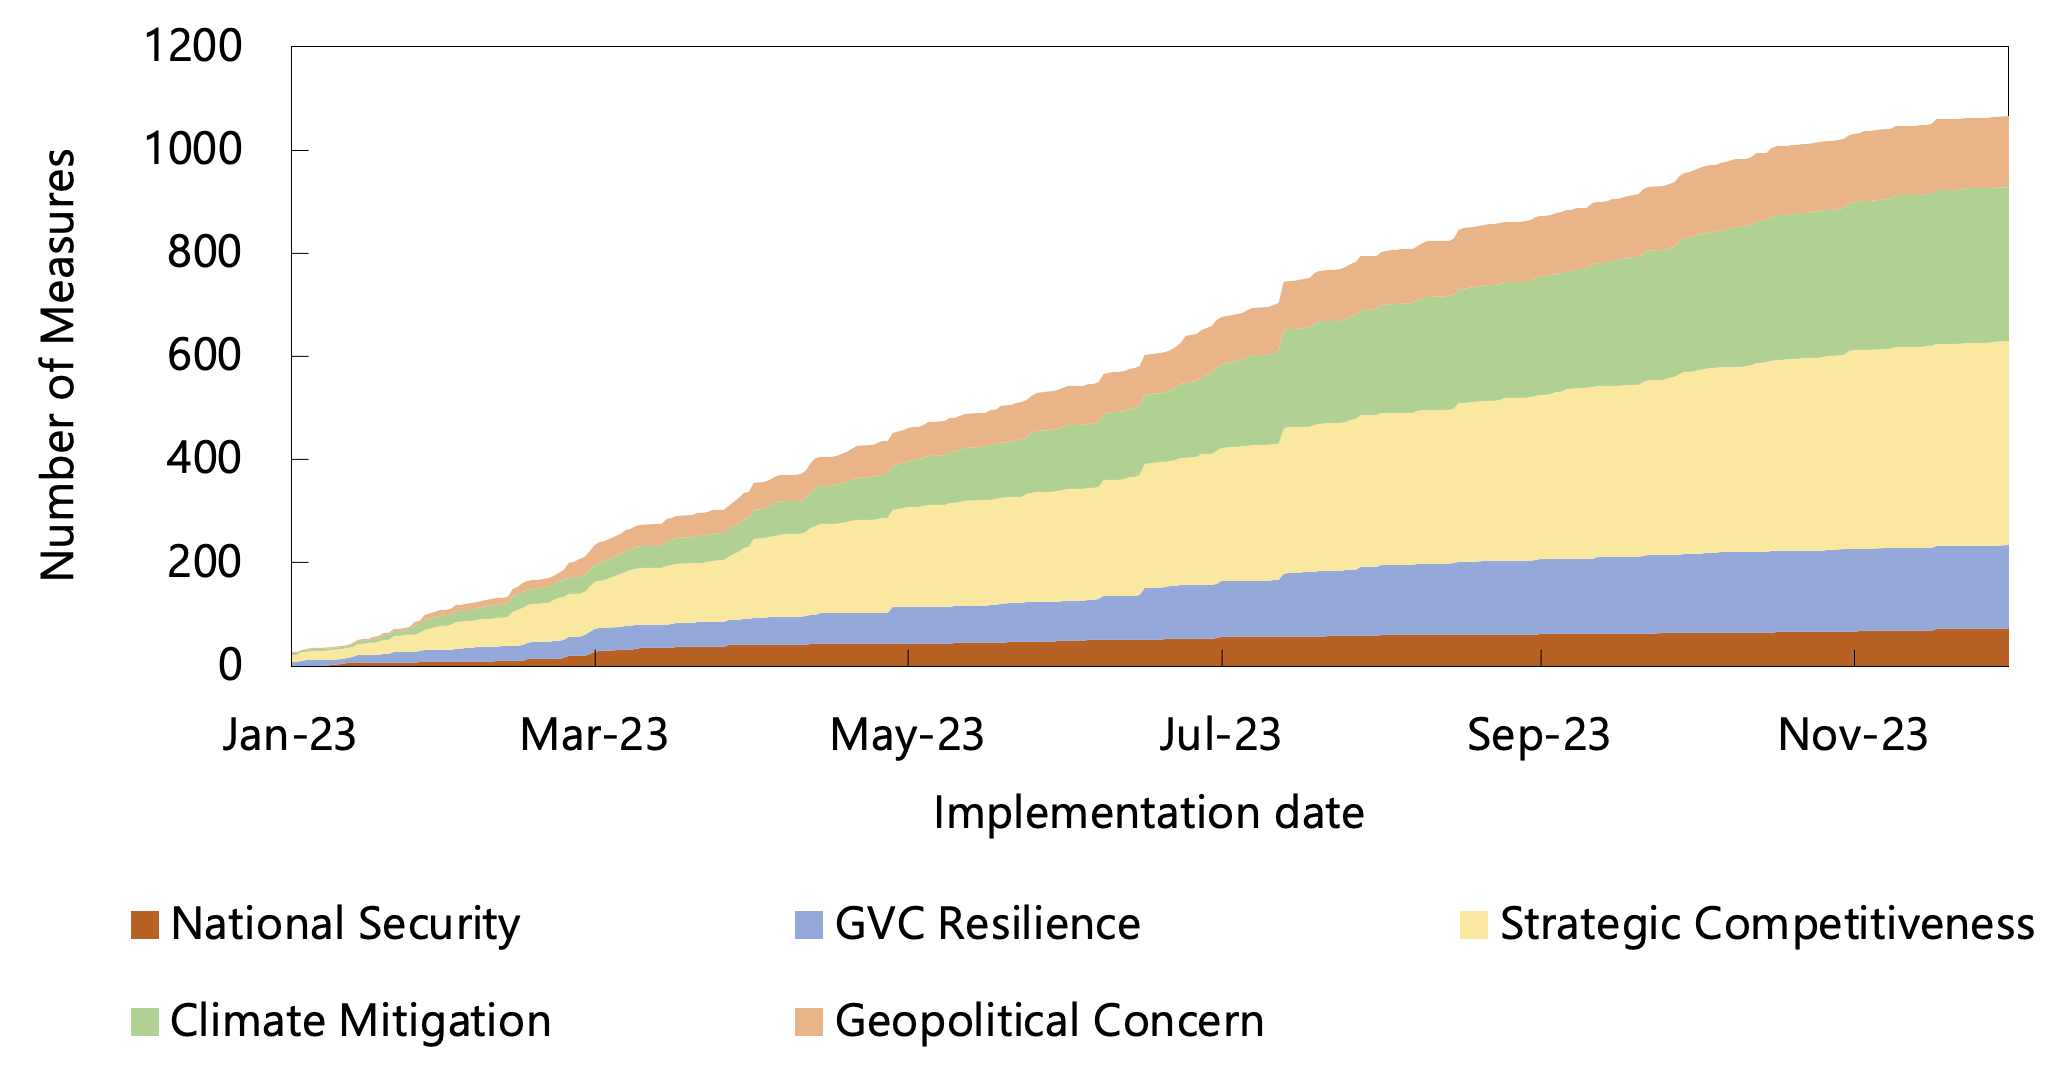
Source: Evenett et al. (2024).
Note: Cumulative stock of measures. For measures with multiple motives, each motive is given equal weight.
- Finally, military/civilian dual use products and other advanced technologies account for the majority of IP interventions (Figure 5). The focus of IP in 2023 has been on military/civilian dual-use products (25.7%), low carbon technology products (15.3%), and other advanced technologies such as medical products and semiconductors (20.6%) and their upstream inputs, such as critical minerals (3.0%). Steel and aluminium, a traditional target of industrial policy, has maintained a notable presence (10.1%) among the newly implemented measures.
Figure 5 Trade distortive industrial policies by sector
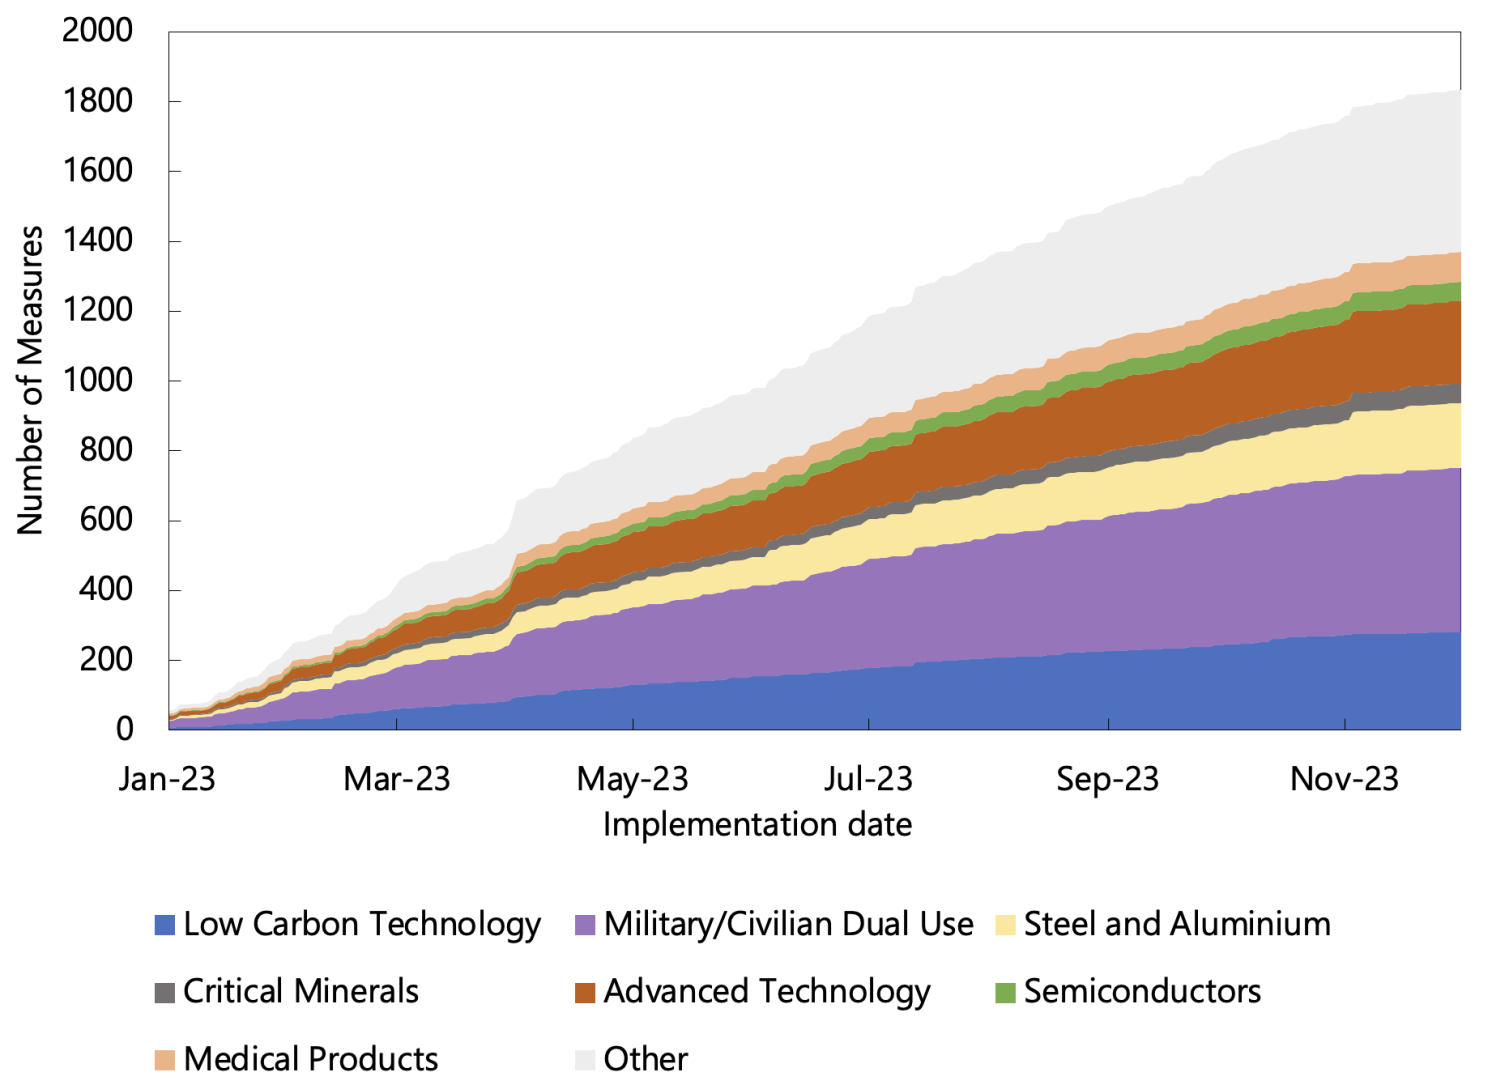

Source: Evenett et al. (2024).
Note: Cumulative stock of measures. For measures covering multiple sectors, each sector is given equal weight.
Political economy and tit-for-tat dynamics matter for IP in 2023
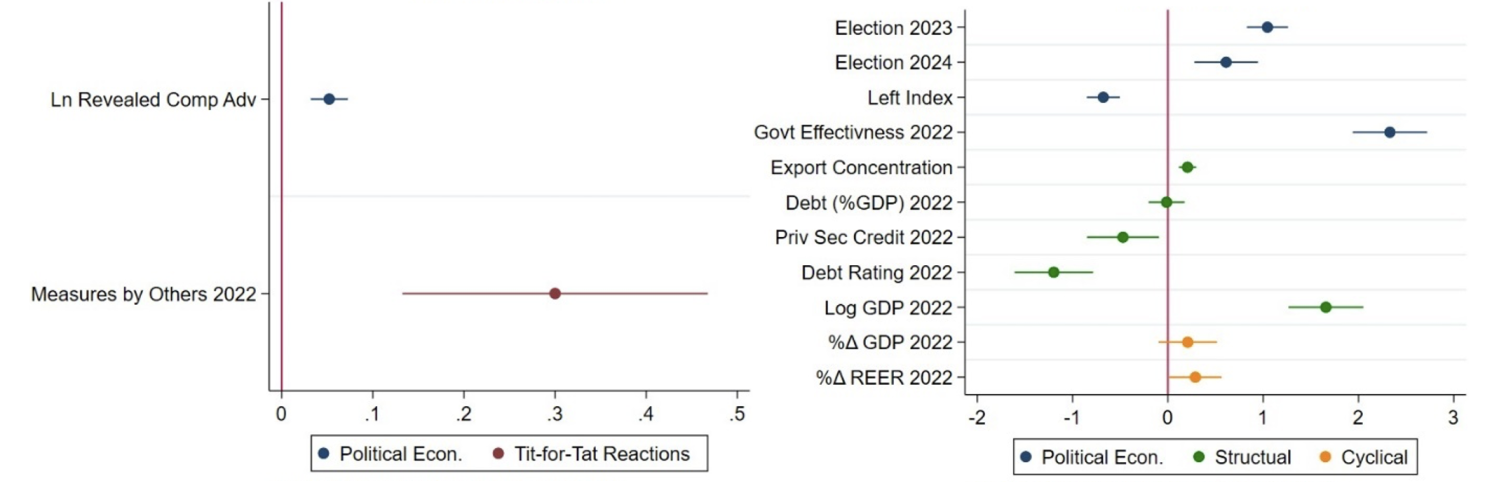
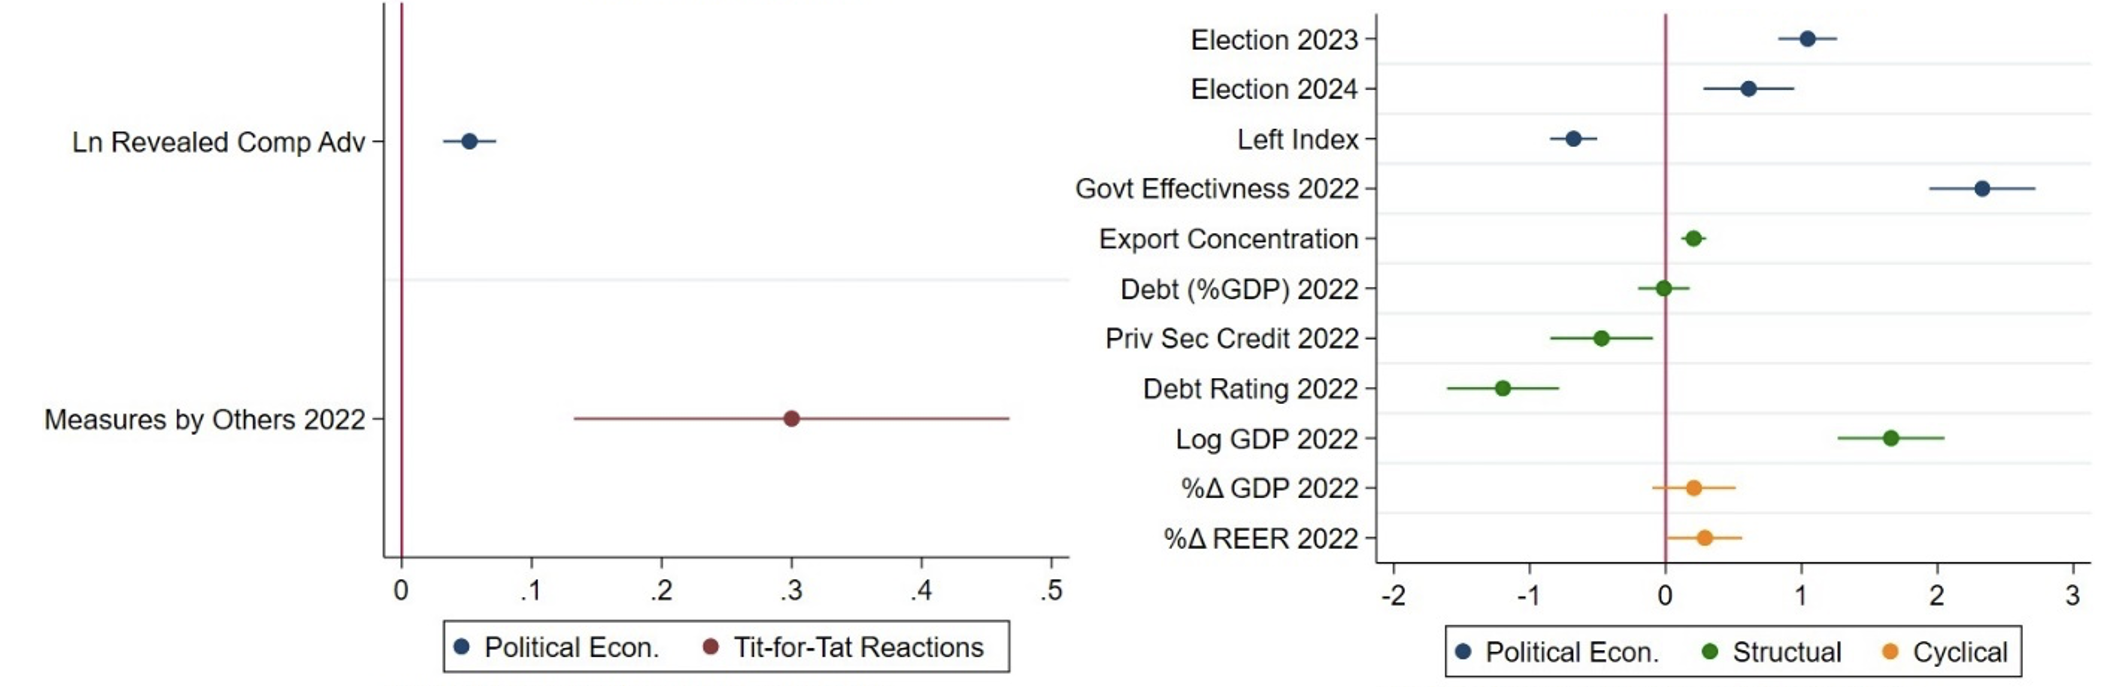
An assessment of the effects of industrial policy measures using the NIPO data would be premature given the short and recent time series at our disposal. But the data can usefully be employed to develop a preliminary assessment of the determinants of NIPs. Specifically, we employ regression analysis to investigate how the use of industrial policy measures correlates with several potential explanatory variables taken from the literature.
Focusing on sectoral characteristics, we find a positive correlation between new industrial policies and revealed comparative advantage, as well as with past IP measures imposed by other countries in the same sectors (Figure 6, left panel). The first result is in line with Juhász et al. (2023): established sectors appear to be more frequent targets of governments’ IP interventions. This finding seems consistent with the view that political economy forces such as the lobbying power of established constituencies are important determinants of the new wave of industrial policy. The second result corroborates the view that IP measures can have negative spillover effects on trading partners and can lead to retaliation and a tit-for-tat dynamic.
We next investigate the country characteristics that are associated with a greater use of IP measures in 2023. We focus on political economy, structural, and cyclical macroeconomic factors (Figure 6, right panel). In countries with an upcoming election, governments are more likely to use IP measures, confirming that political economy motivations are strong determinants of IP. Poorer sovereign debt ratings do not seem to deter policy activism, but rather are positively correlated with IP measures. Cyclical conditions such as a loss of external competitiveness as captured by a real exchange rate appreciation also seems to matter.
While this evidence is purely suggestive and more work is needed to assess the effectiveness of industrial policy, it is noteworthy that IP measures are associated with a number of factors (e.g. retaliation, political economy) that are not clearly related to market failures – the oft-stated efficiency rationale for industrial policy.
Figure 6 Potential determinants of new industrial policies
Source: Evenett et al. (2024).
Note: PPML regressions using (left) country-HS2 and (right) HS6 fixed effects; the dependent variable is the count of measures at the country-HS6 level and regressors are binary (i.e., elections) or standardized continuous variables.
Source : VOXeu


")


")


.jpeg")


")


")


")


")
")

")