Previous optimism that cross-border supply chains would improve efficiency for firms and open up growth opportunities for countries has been tempered by concerns that global value chains now expose firms and countries to the risk of disruptions. This column analyses the evolution of global supply chain patterns centred around the US over the last four decades, with a focus on the post-2017 period. The findings suggest that the ongoing reallocation of global value chain activity comes with costs that need to be monitored and assessed, and that policies to encourage shifts in sourcing patterns may ultimately fail in their objective to reduce US dependence on supply chains linked to China.
Global supply chains have been under the spotlight (Baldwin and Freeman 2020, 2022). In the 1990s, there was optimism that cross-border supply chains would improve efficiency for firms and open up growth opportunities for countries. However, recent events – natural disasters, climate change, the US-China trade conflict, and the COVID-19 pandemic – have raised concerns that global value chains (GVCs) now expose firms and countries to the risk of disruptions (Saito 2013, Bown et al. 2018, Baldwin and Freeman 2020, Pandalai-Nayar et al. 2020). This re-evaluation of GVCs intertwines deeply with a broader backlash against globalisation in numerous developed nations (Colantone et al. 2022). In the US, for example, a significant portion of the public harbours reservations about trade with China, as documented in Alfaro et al. (2023). Recent policies, including tariffs, trade restrictions, and domestic subsidies, have been justified as a way to reduce risks by reshoring and ‘friendshoring’ supply chains (Yellen 2022).
In a paper written for the 2023 Jackson Hole Symposium, we advance a comprehensive analysis of the evolution of global supply chain patterns centred around the US over the last four decades, with a focus on the post-2017 period (Alfaro and Chor 2023). We describe trends in partner countries, products, and modes, and discuss how these reflect shifts toward friendshoring, nearshoring, and reshoring. Using readily available data sources, we synthesise several findings, adding new ones to complement those reported by other authors. We also register some words of caution.
We first provide a longer-run perspective on US sourcing patterns. In terms of locations, the 1990s saw a shift in the US’ direct import sourcing away from high-income countries, such as Japan and Canada, toward low-wage countries, particularly China and Mexico (Figure 1, Panel A, dashed line to grey bars). However, in the face of trade restrictions and rising costs, high-income countries, notably Japan, turned to FDI (blue bar) as a mode for accessing the US market (Alfaro and Charlton 2009). This highlights how decreases in a country’s share of US imports need not signify a decrease in engagement, as alternative modes of globalization such as FDI, need to be taken into account.
In terms of product composition, we use the measurement approach in Chor et al. (2021) to characterise the positioning of the US’ trade flows with respect to final demand (Figure 1, Panel B).The US has consistently been an exporter of upstream products, including equipment and inputs used in processing and assembly overseas, while imports have been relatively downstream (e.g., electronics, textiles, toys); also, in the late 2000s, the US achieved energy independence, becoming a net exporter of upstream petroleum-related products.
Figure 1 US sourcing
A) Imports and foreign MNE sales, shares of totals, 1995 and 2000

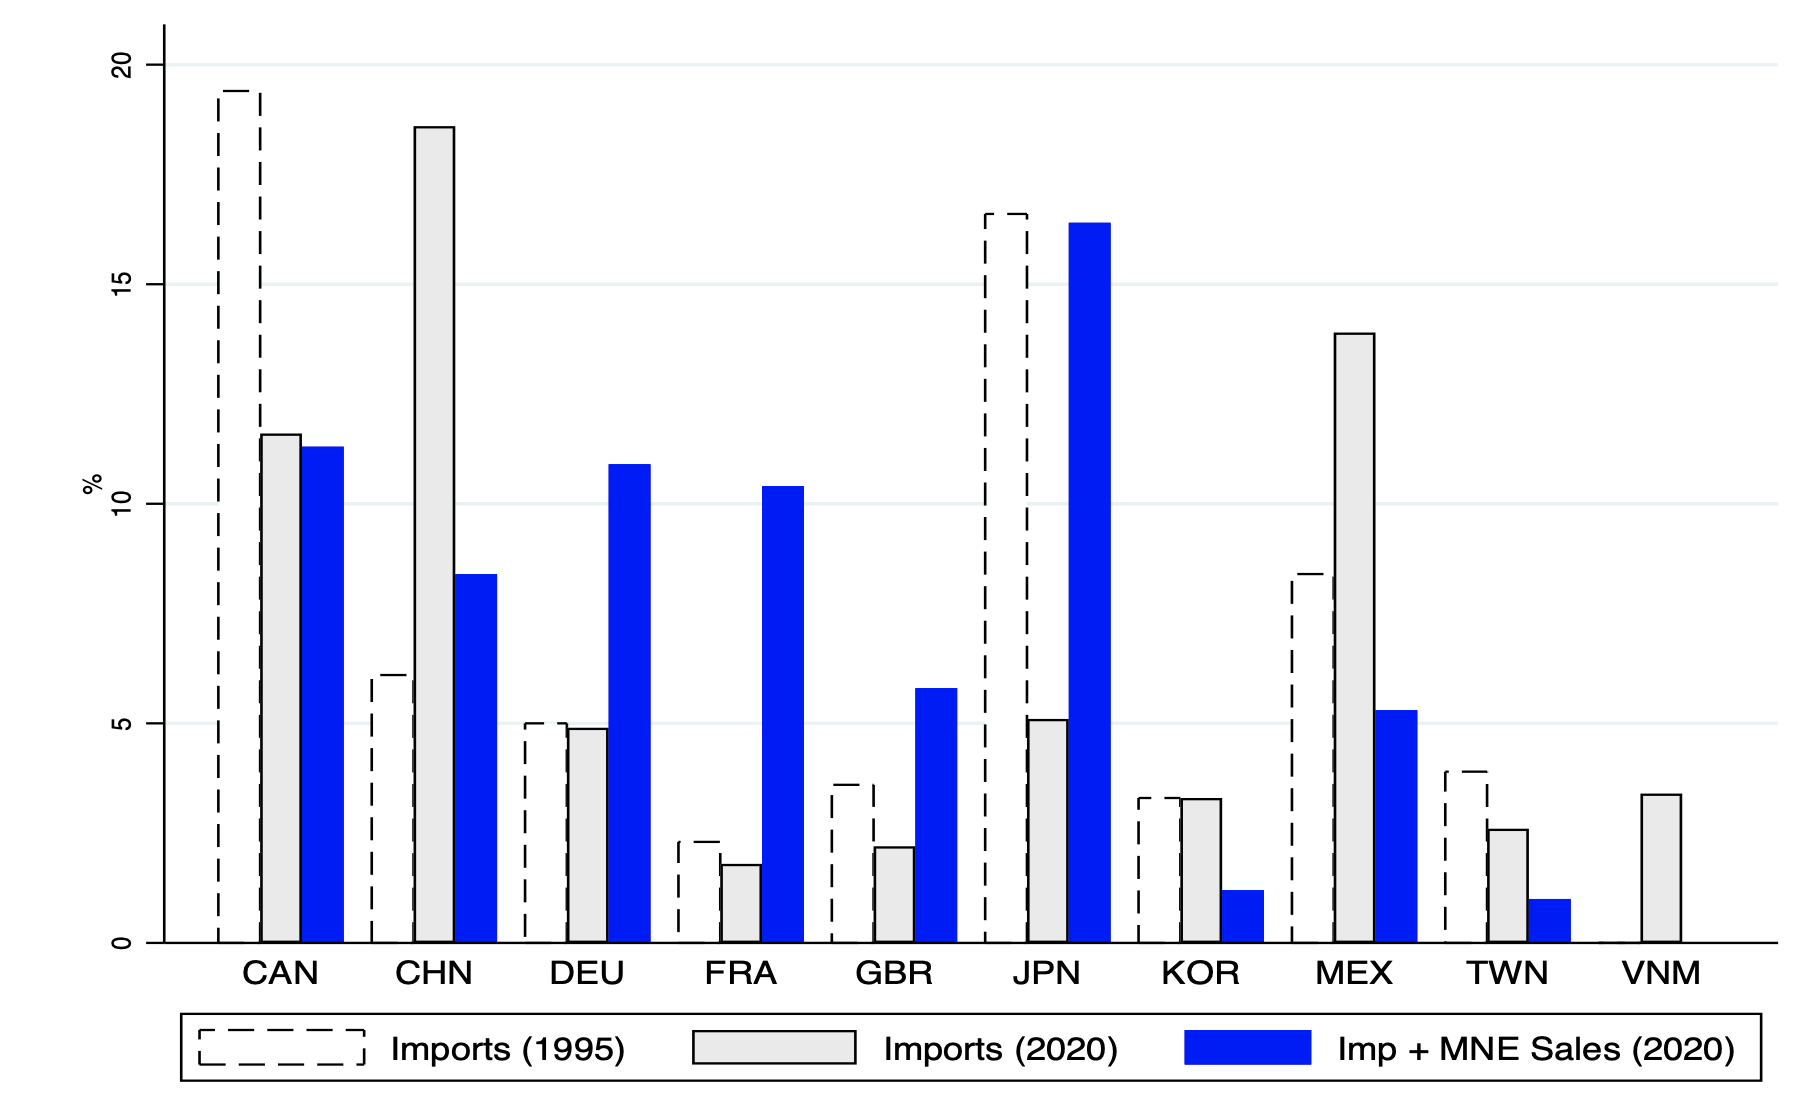
B) US export and import upstreamness, 2002-2022
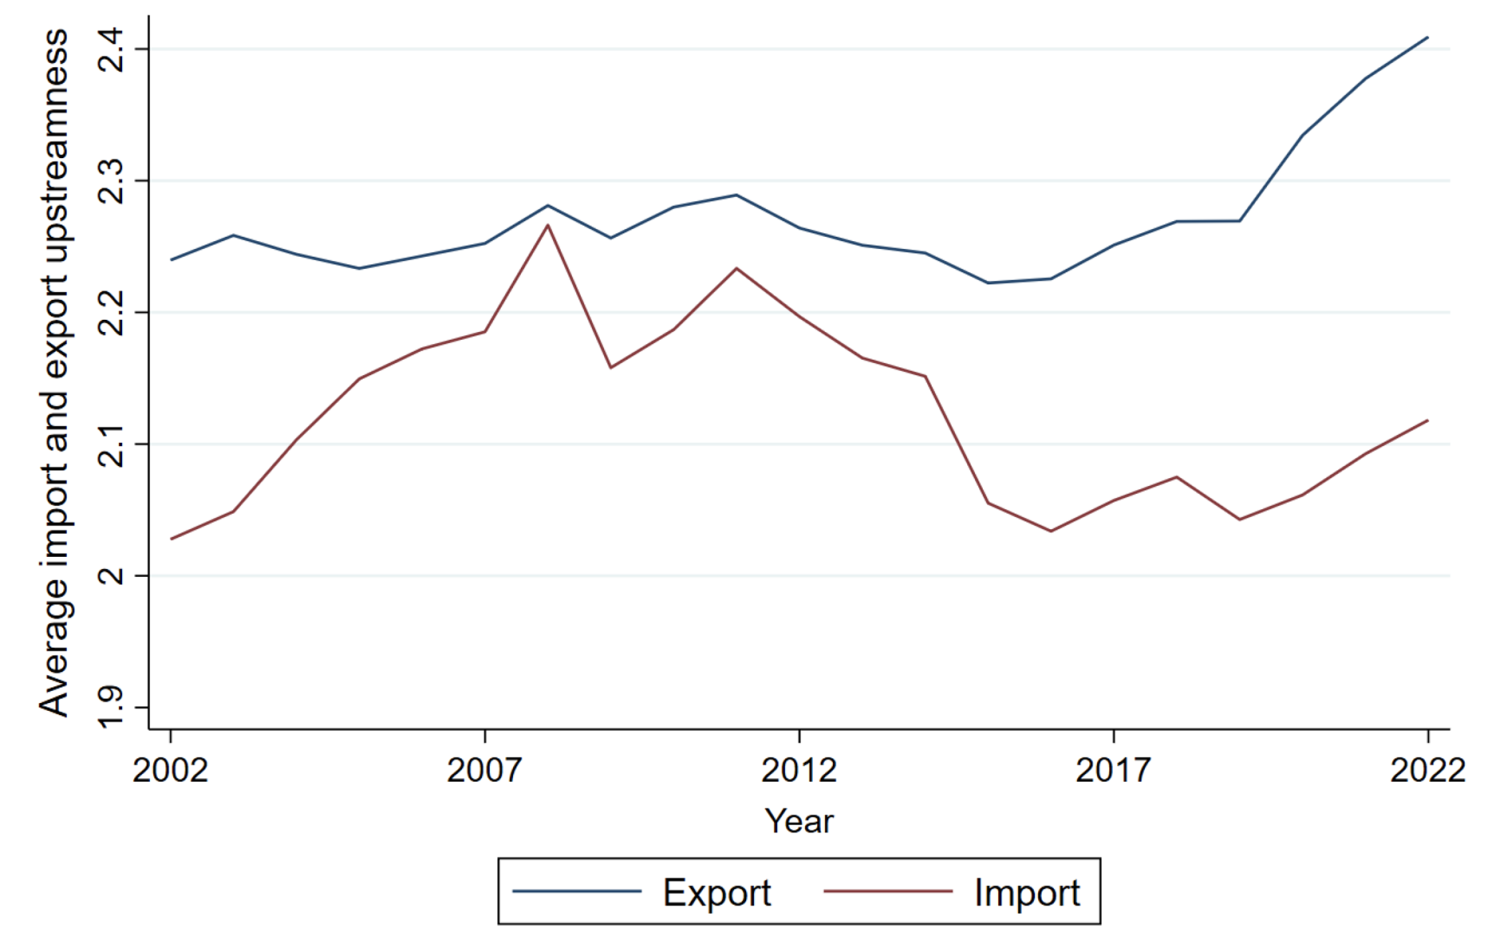

Source: Panel A. Goods trade data (Census Basis) are from the US Census Bureau; downloaded in June 2023. BEA; data downloaded in July 2023. Panel B. Authors’ calculations based on the methodology in Chor et al. (2021), using UN Comtrade data and the 2012 US Input-Output Tables.
Note: The source country for MNC affiliate sales refers to the country of the ultimate beneficial owner. MNC sales are for nonbank affiliates from 1990-2006. From 2007 onward, the MNC sales data are for nonbank affiliates for CA, JP, DE, GB, and FR, but include bank affiliates for all other economies.
Zooming in on the past five years, we advance two key points. First, while this period has seen brewing anti-globalisation sentiment in many countries, we reiterate the findings of other recent studies that this has not led yet to outright deglobalisation (Antràs 2021, Baldwin 2022, Aiyar et al. 2023, Goldberg and Reed 2023). US goods imports, for example, rebounded after the COVID-19 pandemic to all-time highs in volume in 2022, including from China.
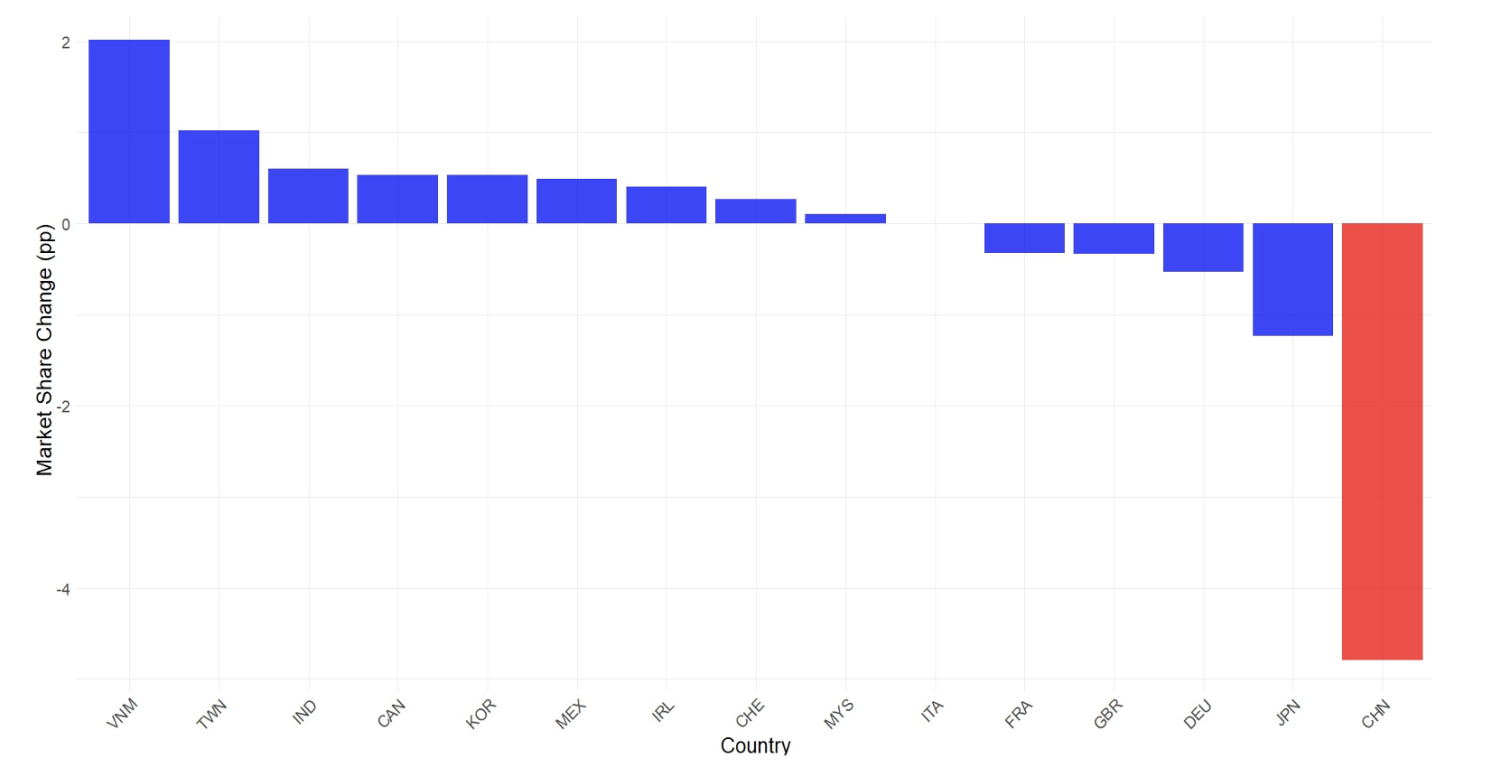
Figure 2 Changes in US import market share
A) US import market share top 15 importing countries, 2017-2022

B) Selected sectors: US import shares, 2010-2022

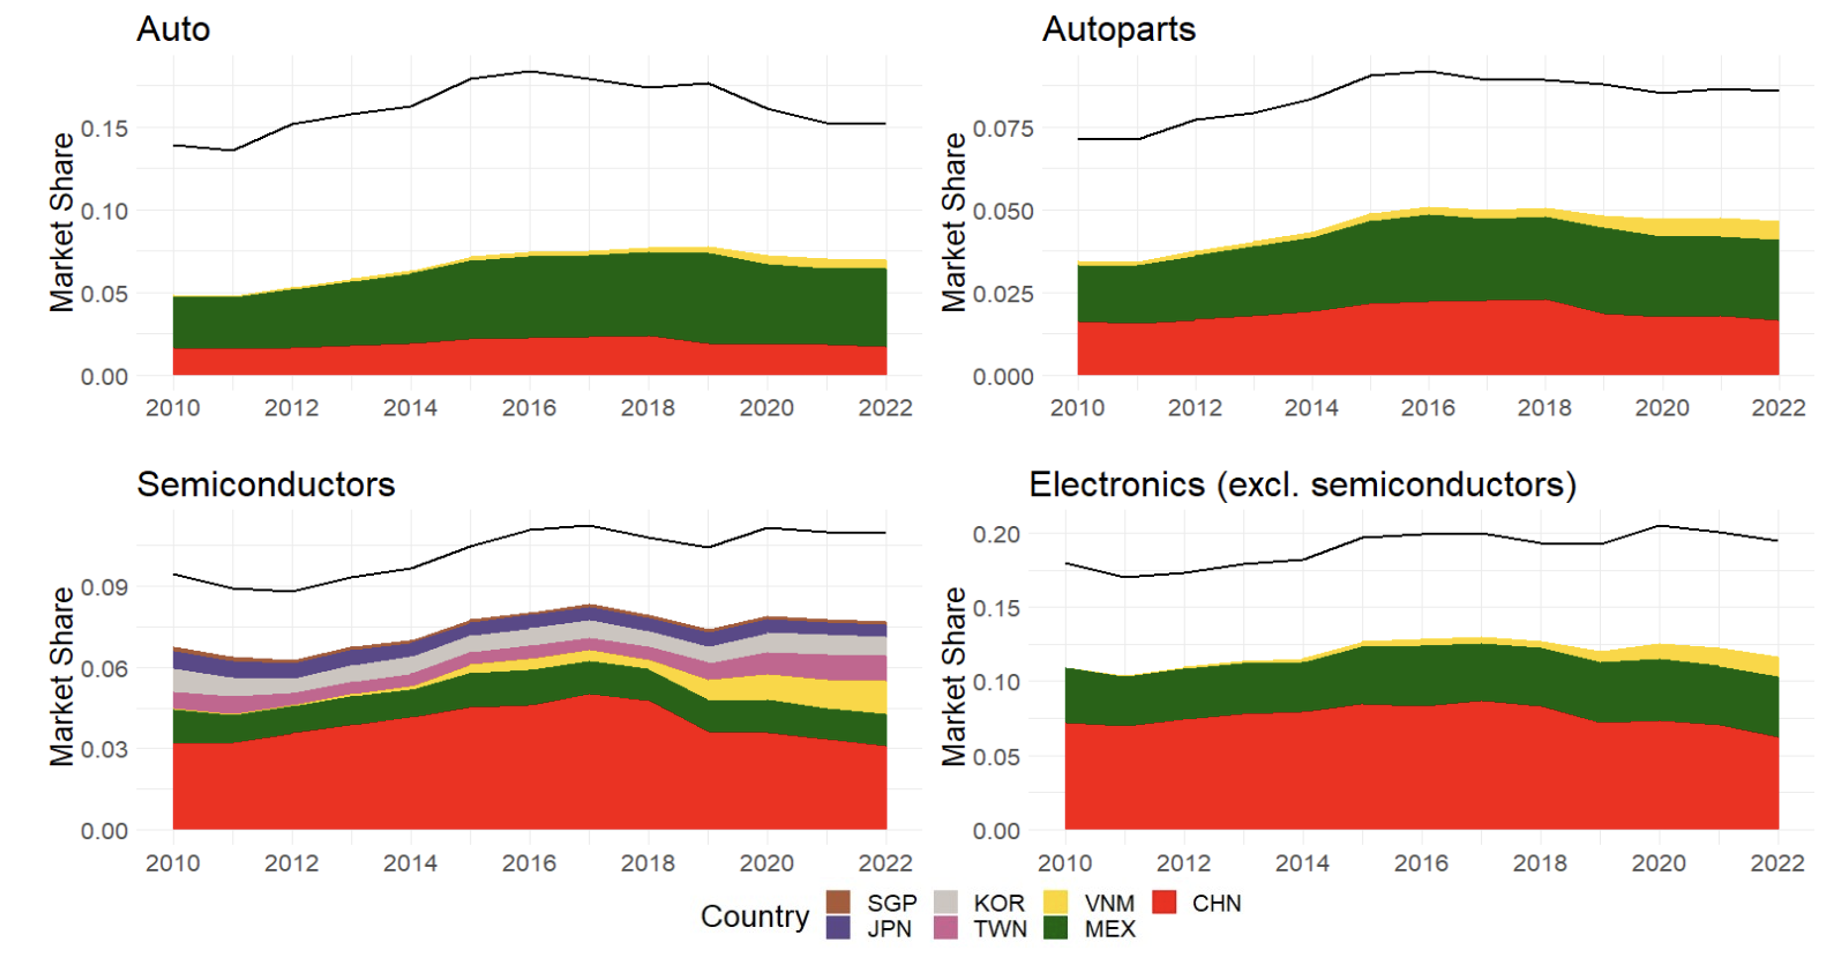
Source: UN Comtrade. Data Downloaded in April 2023.
Second, despite the growth in absolute levels, the data point to a ‘great reallocation’ of US direct sourcing away from China. China saw its share of US imports fall significantly by around 5 percentage points (see Figure 2, Panel A), a pattern also reported by other researchers (Kitzmüller et al. 2022, Grossman et al. 2023, Freund et al. 2023). Thus far, countries in Asia have emerged as big winners, with low-wage Vietnam experiencing the largest share increase of close to 2 percentage points. Canada and Mexico also gained in their US import market share, while Japan and Germany saw their shares continue to slip; this reinforces how the US’ trading relationships are still characterized by regional value chains (Baldwin and Gonzalez-Lopez 2015).
The decline in China’s import market share after 2017 is evident in sectors central to US policy discussions. Figure 2 highlights the gains by Vietnam and Mexico in auto parts, electronics, and semiconductors, while Mexico also gained market share in autos, another critical sector in policy debates (Panel B). The reallocation toward other source countries, symbolic of ‘friendshoring’ and ‘nearshoring’, is evident across traded HS4 products: Figure 3 shows that the decreases between 2017-2022 in China’s share of US imports is systematically correlated with gains in the import shares from Vietnam and Mexico (even after accounting for pre-trends in these countries’ shares of the US market).
Figure 3 Correlations between import share from China versus Vietnam and Mexico, 2017-2022
A) Vietnam

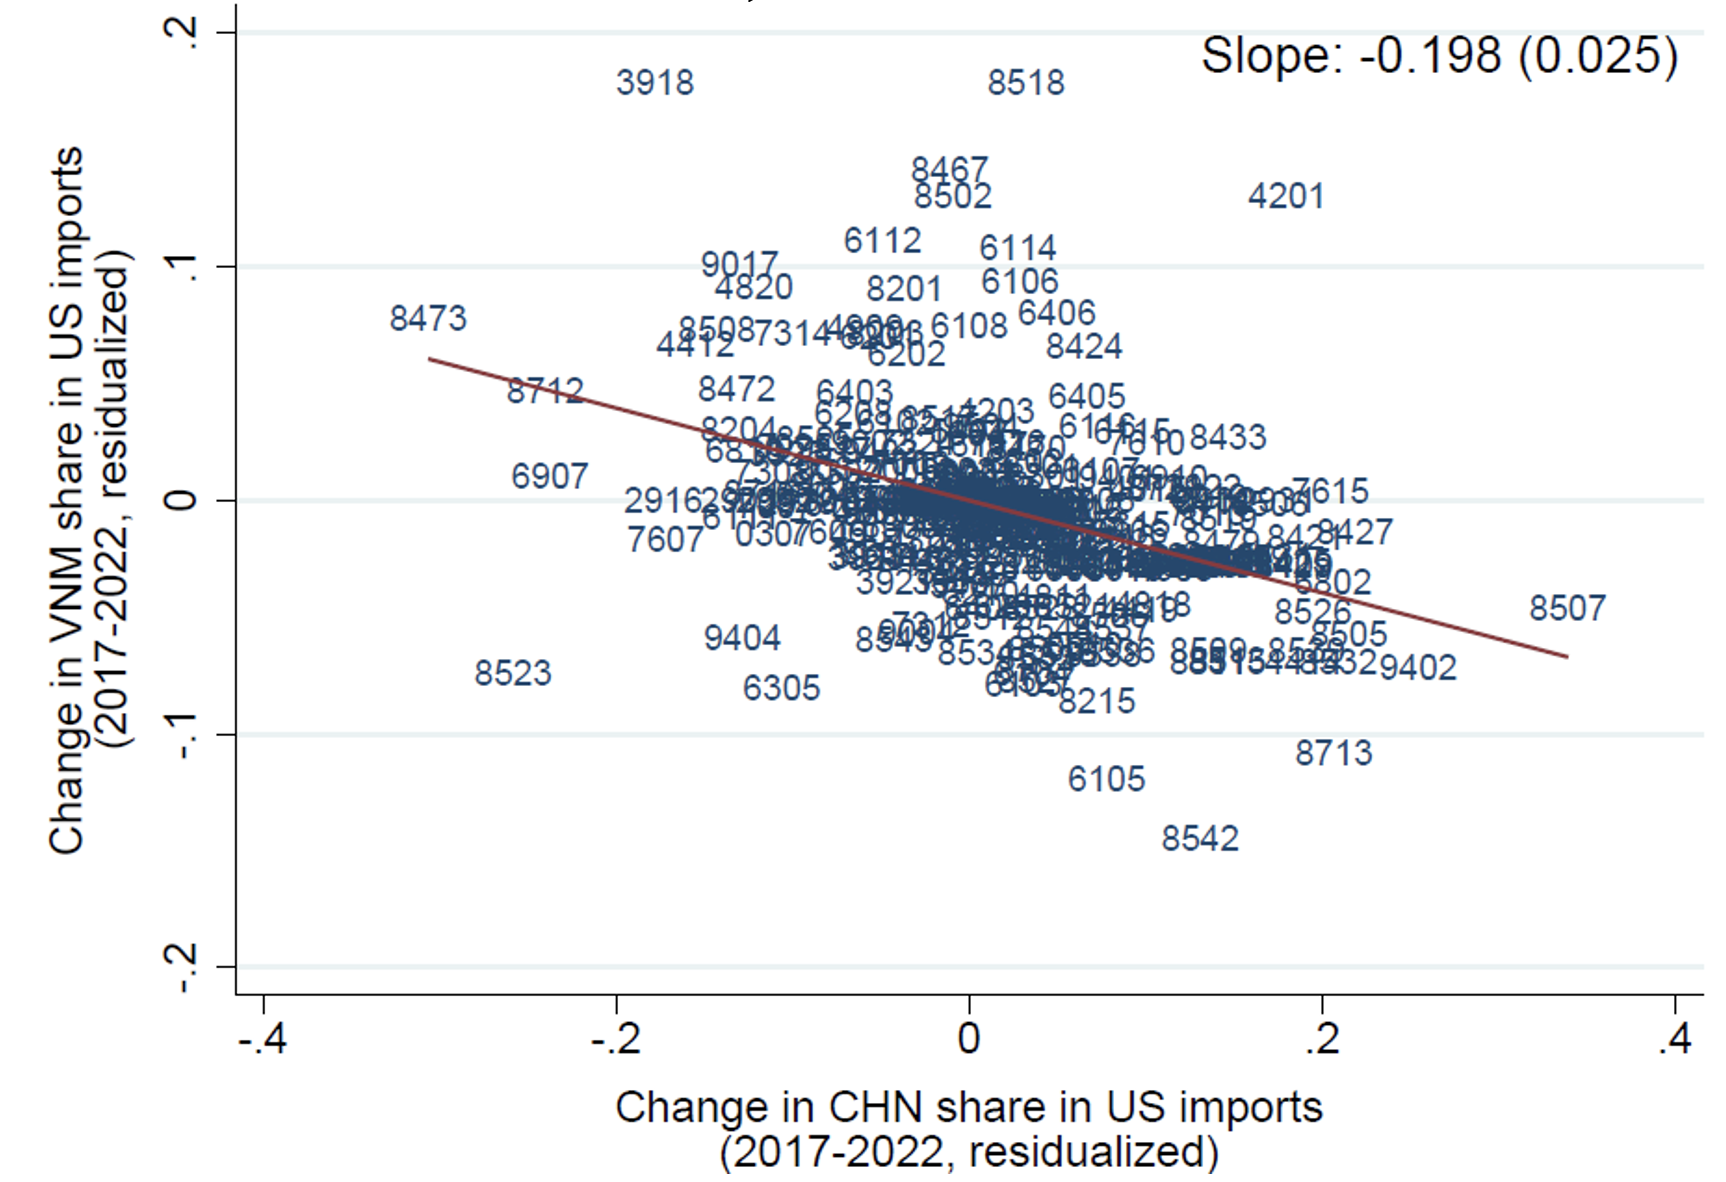
B) Mexico
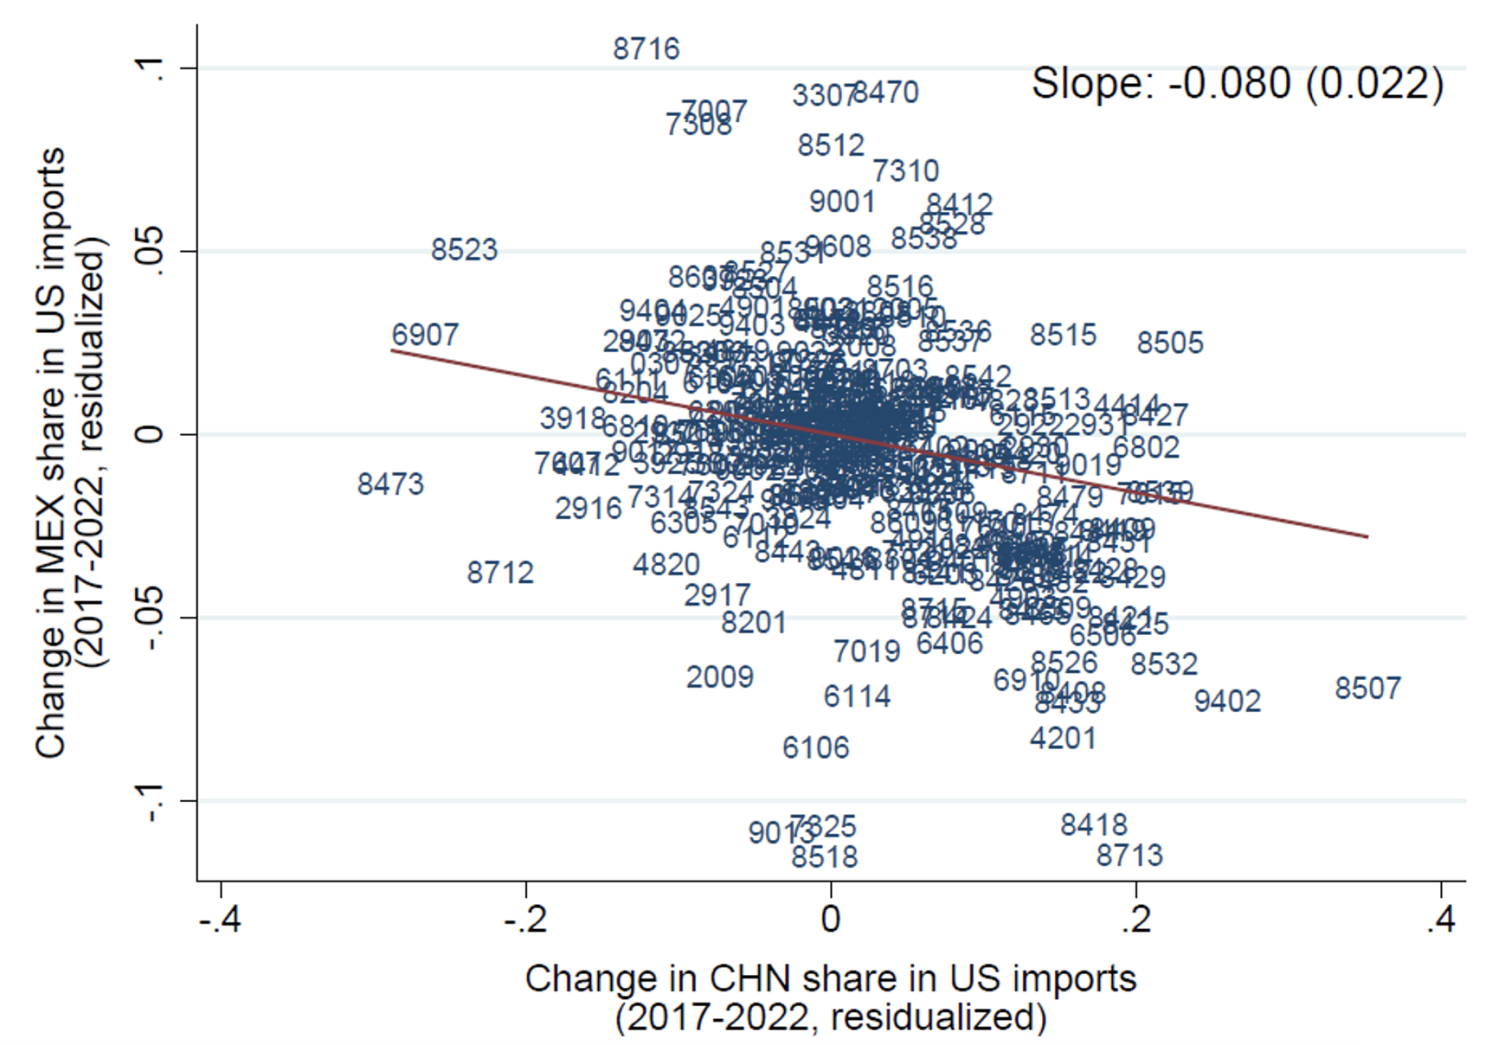

Notes: Residualised scatterplots after accounting for variation explained by the 2012-2017 change in Vietnam (respectively, Mexico) HS4-digit product import share pre-trends, and by HS2-digit fixed effects. The residualised 2017-2022 change in Vietnam (respectively, Mexico) share in US imports is on the vertical axes. For the top 300 HS4-digit products by 2017 import value from China.
The reallocation observed in trade statistics is corroborated by evidence on friendshoring, nearshoring, and reshoring from other sources. As documented in the paper, since 2018, such references – on potential moves away from China toward Vietnam and Mexico – have appeared more frequently in companies’ earnings calls (from NL Analytics). Meanwhile, China has dropped off in prominence as a preferred destination for greenfield FDI (from fDi Markets). In terms of reshoring, the upstreamness of US imports rose slightly over the past five years (Figure 1, Panel B), suggesting that more production stages closer to the final consumer are now being performed in the US. The available data on US manufacturing employment and establishments (from the Bureau of Labor Statistics) presents a more nuanced picture of the extent of reshoring. Some key sectors, such as semiconductors, display a resurgence post-2021. In other sectors, such as autos, the current growth stems more from trends that precede 2017. Some sectors, such as auto parts, have yet to fully regain their prior share in US manufacturing.
This ‘great reallocation’ away from China has largely been the result of intentional government policies, which have prompted firms to reconsider their global supply chain decisions (Ahn et al. 2023, Aiyar et al. 2023, WTO 2023). These policies include the introduction of tariffs on China by the Trump administration; the continued use of these trade barriers under the Biden administration; and the rollout of domestic policies such as the Inflation Reduction Act (IRA) and the CHIPS and Science Act.
We register two cautionary notes regarding the policies that have set this reallocation in motion. First, the ongoing reallocation of GVC activity comes with costs that need to be monitored and assessed (Eppinger et al. 2021, Javorcik et al. 2022). Already, there is a strong body of empirical work showing that the US tariffs on Chinese goods have been costly and regressive from a consumer surplus perspective, as there has been a near-complete pass-through of these tariffs to US buyers (Furman et al. 2017, Amiti et al. 2019, Fajgelbaum et al. 2020, Cavallo et al. 2021).
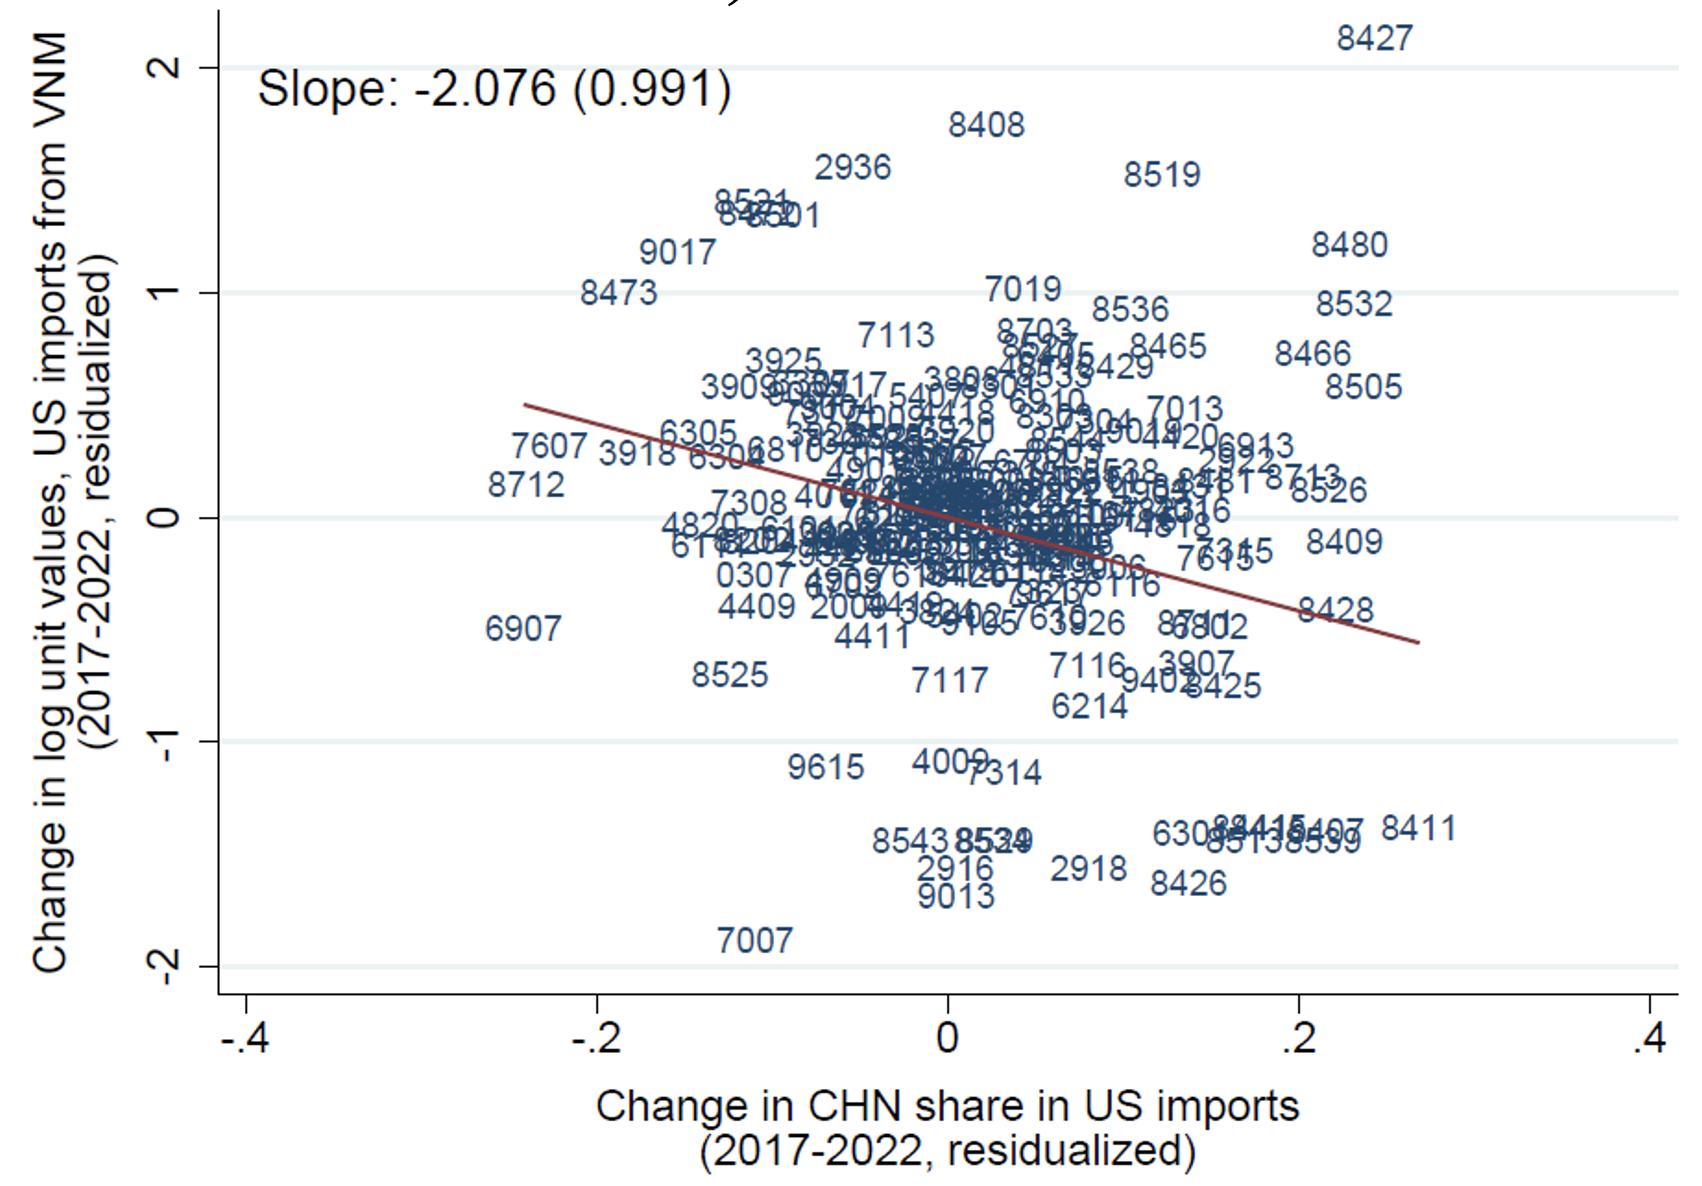
Figure 4 Correlations between import share from China versus unit values in Vietnam and Mexico, 2017-2022
A) Vietnam

B) Mexico

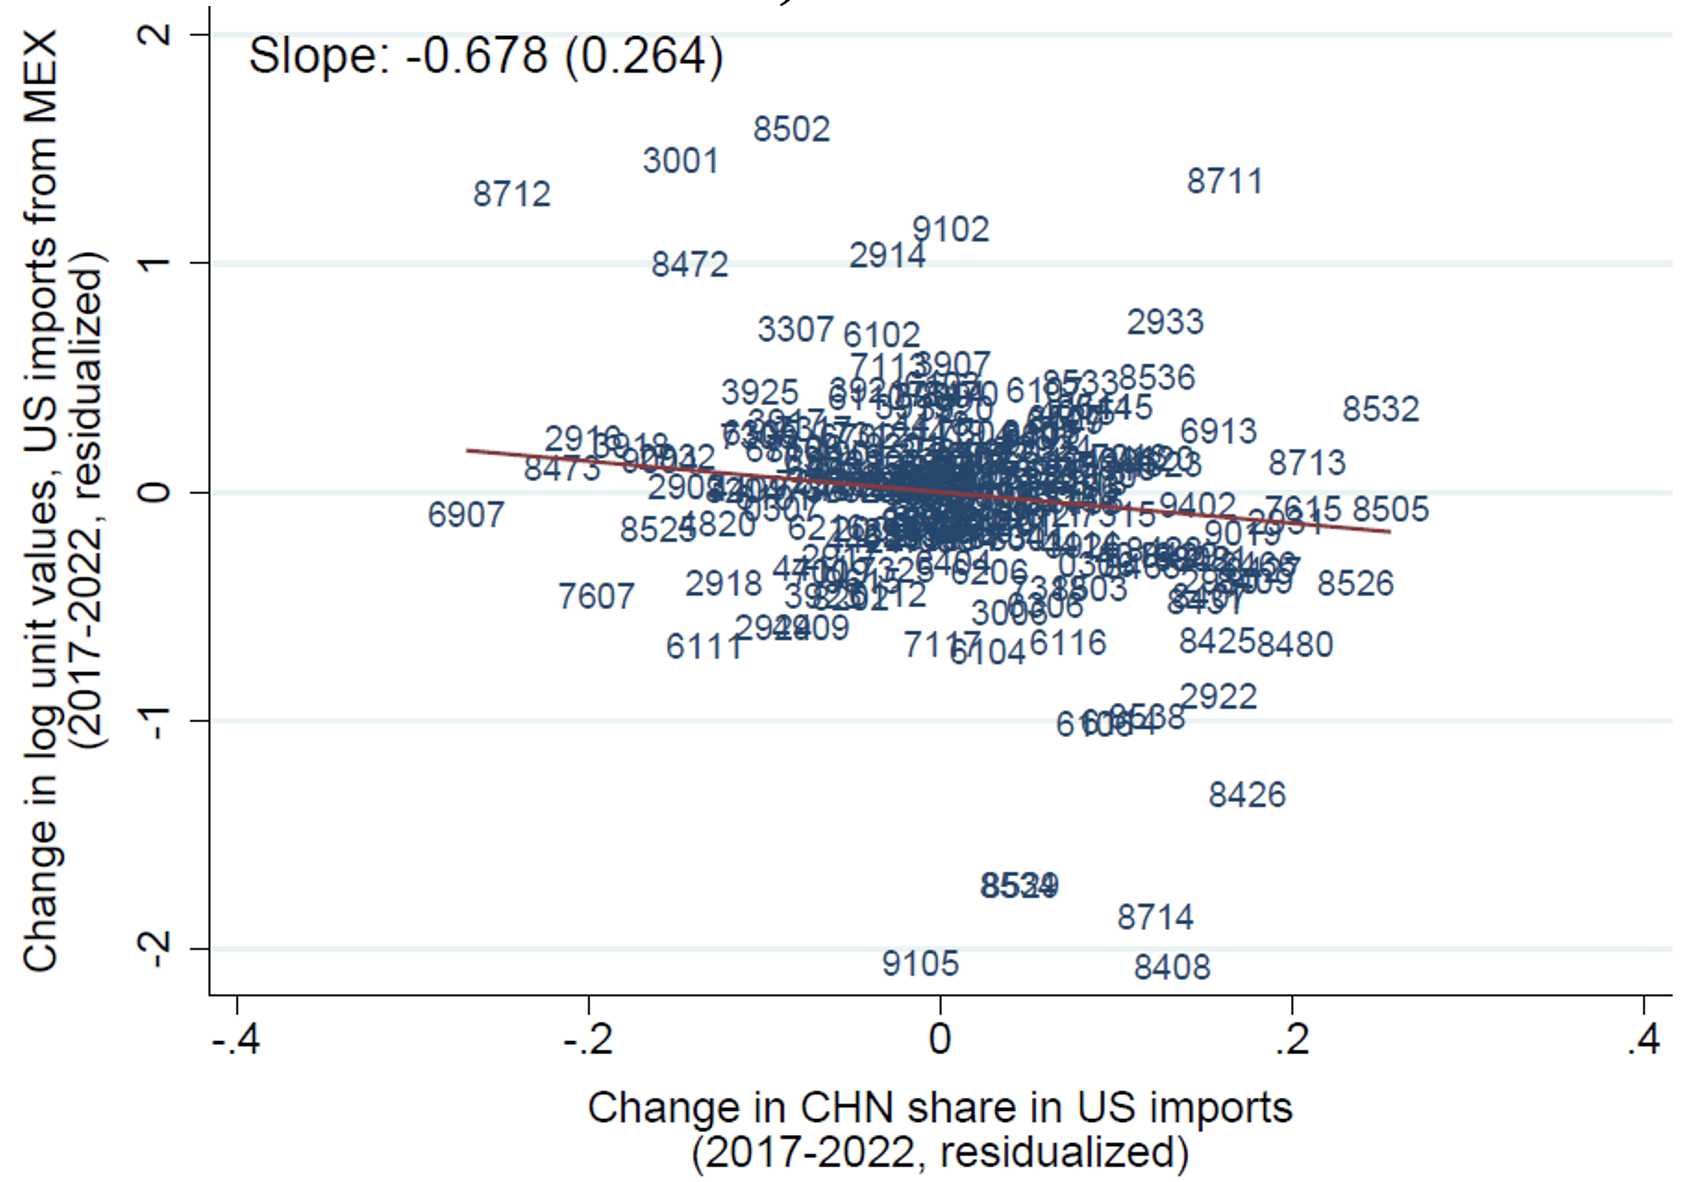
Notes: Residualised scatterplots after accounting for variation explained by the 2012-2017 change in Vietnam (respectively, Mexico) HS4-digit product import unit value pre-trends. The residualised 2017-2022 change in the log unit value of US imports from Vietnam (respectively, Mexico) on the vertical axes. For the top 300 HS4-digit products by 2017, import value from China.
Our work adds a new dimension on these price effects, with evidence that the reallocation of trade to other countries has also been associated with significant increases in import prices from these alternative sources. We document that decreases in product-level import shares from China are associated with rising unit values for imports from Vietnam and Mexico, likely from a combination of demand-pull and cost-push factors (see Figure 4). Given the five percentage-point trade-weighted average decrease across products in the share of US imports from China, this is associated based on our estimates with a 9.8% (respectively, 3.2%) rise in the unit prices of imports from Vietnam (respectively, Mexico). Thus, the policies to encourage shifts in sourcing patterns may well contribute to wage and cost pressures in the US (Forbes 2019, Obstfeld 2019, Amiti et al. 2023).
A second point of caution is that the policies may ultimately fail in their objective to reduce US dependence on supply chains linked to China. While the US has decreased direct reliance on China via imports, China has increased its import market share in third countries, including all the US’ top-five import partners with the exception of Japan (Panel A, Figure 5); China remains the primary or second most important import partner in all these countries (Freund et al. 2023). To the extent that Chinese firms’ exports to these other locations involve components assembled into later-stage goods that are then sent to the US market, China would ultimately continue to be a relevant player in the upstream stages of US supply chains. Chinese FDI in the manufacturing sectors of Vietnam and Mexico has also been growing, albeit from a low base (Panel B). Overall, this suggests that plants in which China is the ultimate owner may continue to play a significant role in US value chains, even as geopolitical forces may prevent China from engaging directly in FDI in the US (as Japan did in the 1980s and 1990s).
Figure 5 Direct and indirect sourcing
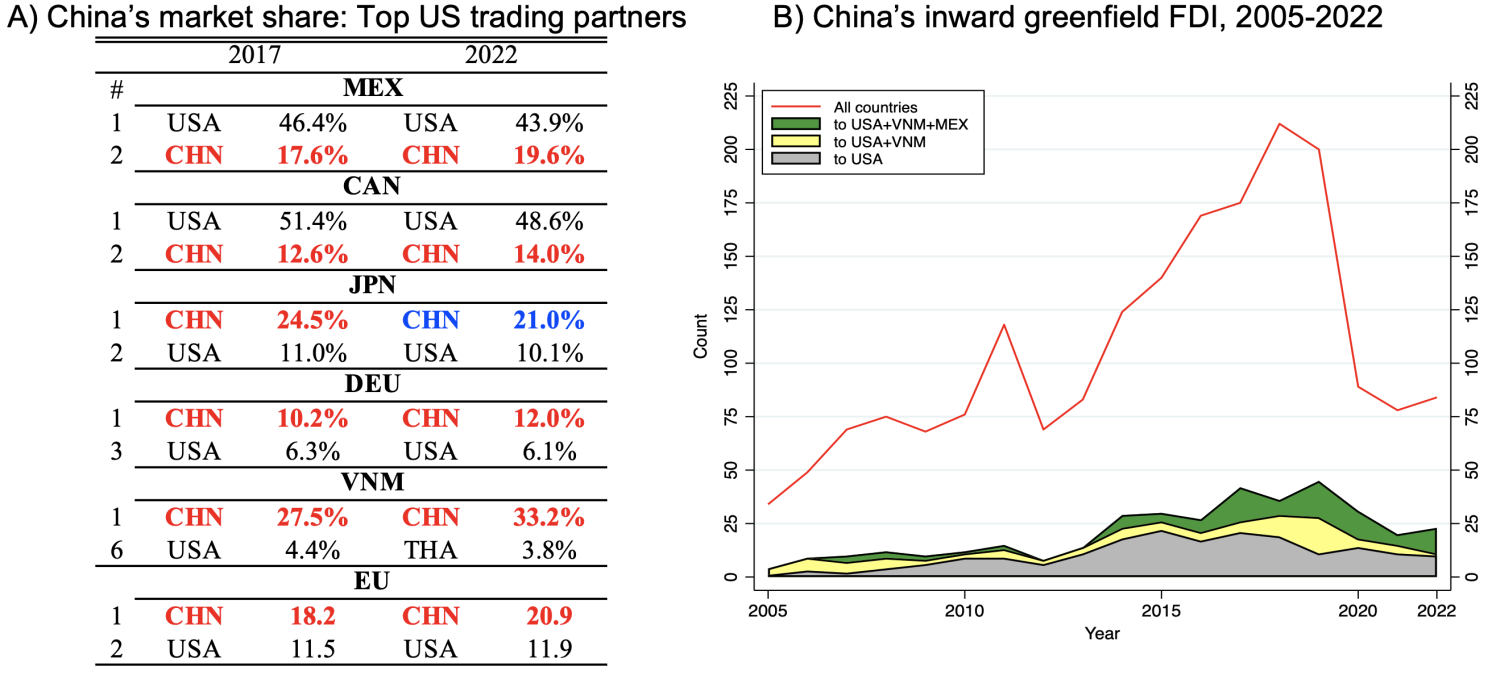
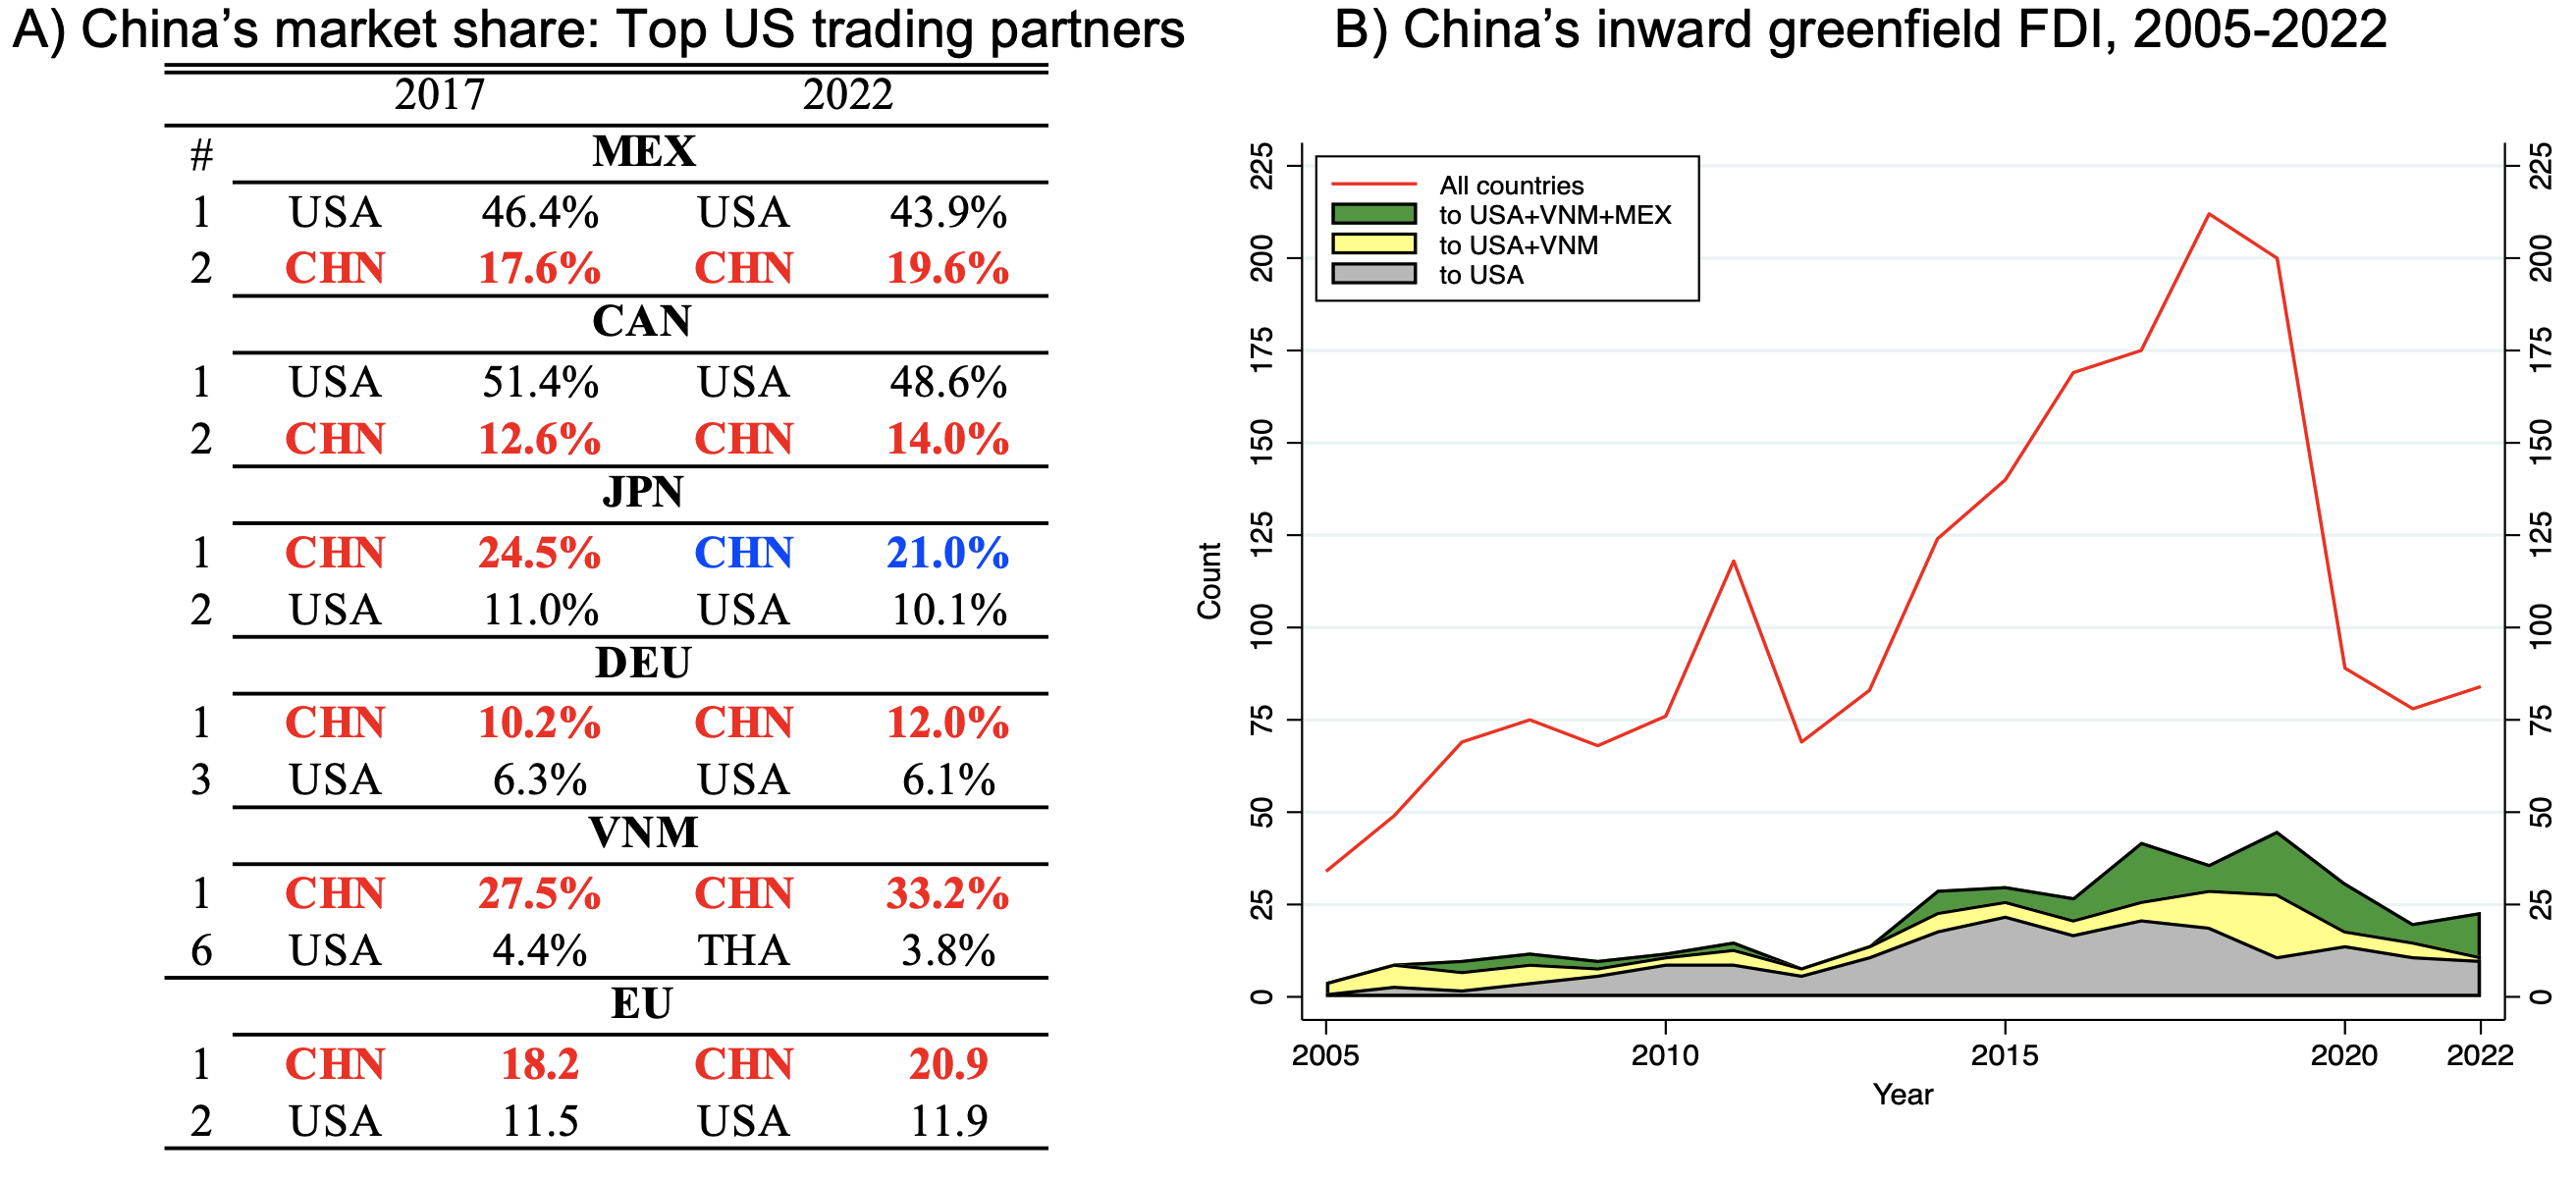
Sources: Comtrade, Eurostat; fDi, Markets.
There is much scope in future research to study the impact of this supply chain reallocation on firms’ profitability and productivity. Moreover, what is arguably missing amid current debates is an explicit articulation of the need to formally evaluate the welfare trade-offs incurred by current policies, to assess whether the dynamic gains from reshoring, usually arising from agglomeration effects or increased innovation, can indeed offset the static welfare losses incurred from pursuing this goal. The task is challenging. For example, as Goldberg and Reed (2023) note, there is no established framework or quantitative benchmark for assessing ‘resilience’.
Source : VOXeu


")


")


.jpeg")


")


")


")


")
")

")