Despite a renewal of public and scholarly attention to inequality, little is known about the role of government taxes and transfers in shaping inequality across countries and over time. Based on a database on the distribution of taxes and transfers in 151 countries, this column uncovers a number of new results on the evolution of fiscal progressivity around the world since 1980. The bulk of cross-country differences in inequality appear to be explained by differences in the distribution of pre-tax incomes, not redistribution. This fact calls for much more research on the drivers of pre-tax inequality.
Despite a momentous renewal of public and scholarly attention to inequality (Minelli 2014), little is known about the role of government taxes and transfers in shaping inequality across countries and over time – least of all in the developing world. While some efforts have been made in specific contexts, including the US (Piketty et al. 2018), France (Bozio et al. 2023), Europe as a whole (Blanchet et al. 2022), and Latin America (Lopez-Calva and Lustig 2010), there is a critical lack of worldwide data on how redistribution varies across countries and has evolved in the past decades.
As a result, it has remained difficult to answer questions as simple as:
- Which countries do the most to reduce income disparities through taxes and transfers?
- Is redistribution higher than it was 40 years ago?
- Are differences in inequality primarily driven by differences in the distribution of market incomes (‘predistribution’), or by differences in tax-and-transfer systems (‘redistribution’)?
In a new paper (Fisher-Post and Gethin 2023), we make a first step towards answering these questions. Combining new data sources and methods, we assemble a comprehensive database on the distribution of taxes and transfers in 151 countries since 1980.
We establish five main findings:
- Tax-and-transfer systems always reduce inequality, but with large variations.
- About 90% of these variations are driven by transfers, while only 10% come from taxes.
- Redistribution rises with development, but this is entirely due to transfers; tax progressivity is uncorrelated with per capita income.
- Redistribution has increased in most world regions, except in Africa and Eastern Europe, where it has stagnated.
- About 80% of variations in post-tax inequality are driven by differences in pre-tax inequality (predistribution), while 20% are driven by the direct effect of taxes and transfers (redistribution).
A new database on government redistribution worldwide
Drawing on a number of sources and methods, we construct new estimates of government redistribution in 151 countries from 1980 to 2019. Our measures of redistribution account for all forms of taxes and transfers, including personal income taxes, corporate taxes, consumption taxes, local taxes, cash transfers, and public education and health expenditure. Tax revenue aggregates, by type of tax, are drawn from Bachas et al. (2022a), while pre-tax income distributions are available from the World Inequality Database. We distribute taxes and transfers using a common methodological framework – Distributional National Accounts (DINA; Blanchet et al. 2021) – which ensures that our estimates are consistent with national income and government budget aggregates, and comparable across countries and over time.
In the absence of survey or tax microdata, which largely do not exist for our sample, several methodological innovations allow us to estimate the distributional incidence of taxes and transfers. We model the distributional incidence of taxes from a number of parameters on inter alia statutory tax schedules, functional income concentrations, and the relative weights of disaggregated tax components, for which we put together data from several sources. Similarly, we complement our new series on total government expenditure by function with information on the distributional incidence of social assistance, education, and healthcare, drawing on related work by Gethin (2023).
Drawing on this database, we establish five new stylised facts.
1) Tax-and-transfer systems inequality
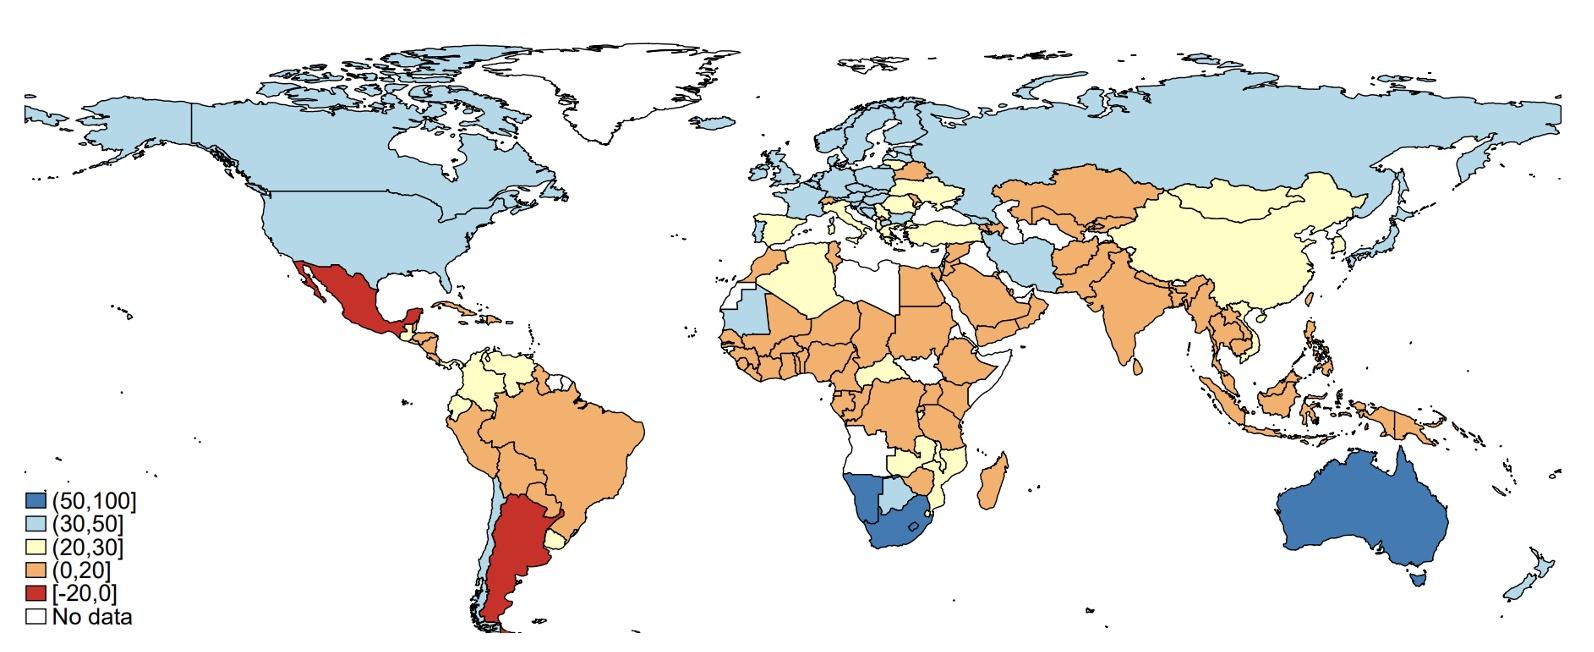
Tax-and-transfer systems always reduce inequality. One way to measure this is to compare the top 10% to bottom 50% average income ratio in terms of pre-tax and post-tax income. Taxes and transfers reduce this ratio in nearly all 151 countries in our sample. This effect varies considerably, however, from 15% in the average African country to over 30% in Europe and the US (see Figure 1).
Figure 1 A global map of redistribution: Percent reduction in top 10% to bottom 50% income ratio, from pre-tax to post-tax

2) Transfers are the dominant driver of redistribution
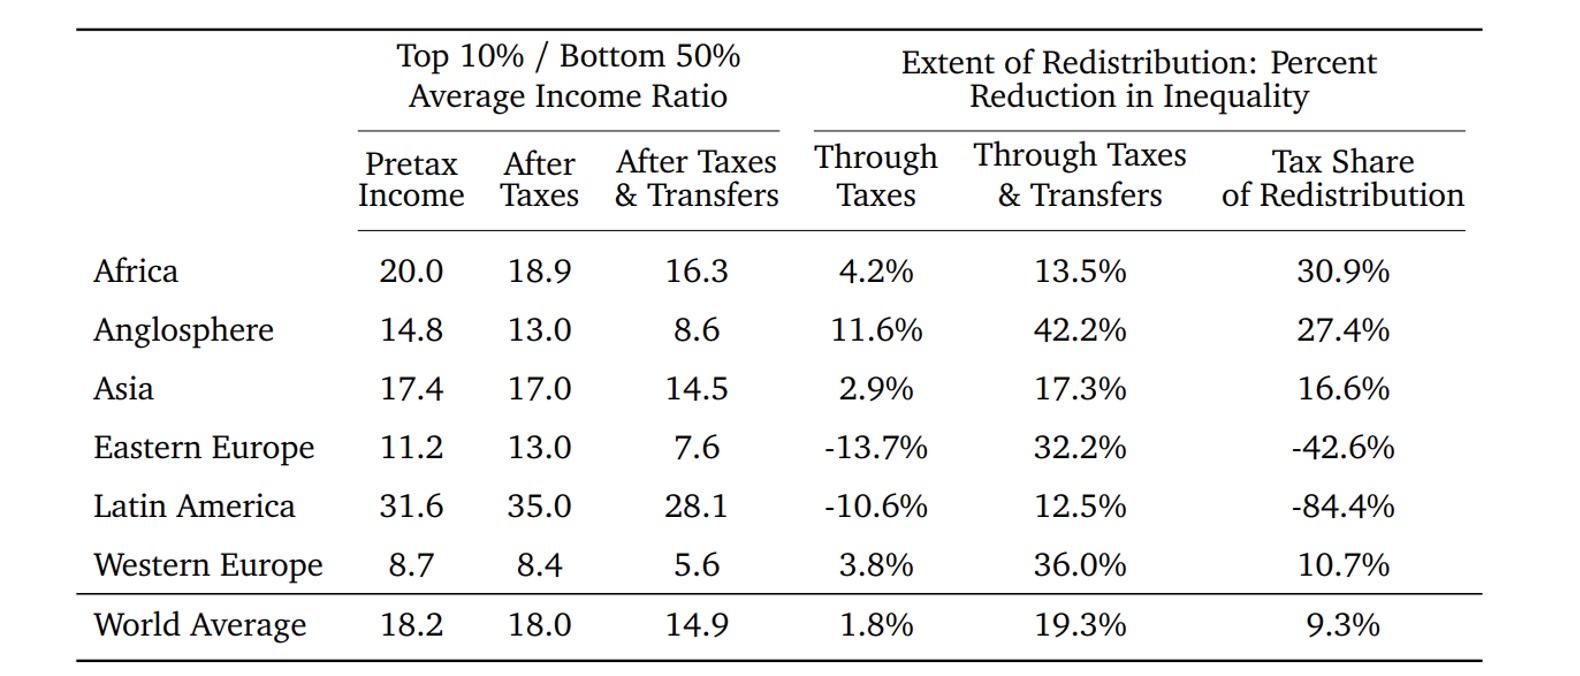
Transfers are the dominant driver of this redistributive effect. Taxes appear to have almost no effect on inequality in most regions of the world: low-income households face about the same effective tax rate as high-income households. As a result, removing taxes from individual incomes reduces inequality by about 2% in the average country (see Table 1). In contrast, transfers always strongly reduce inequality, typically by about 20%. Putting these two facts together, we estimate that over 90% of the effect of tax-and-transfer systems on inequality comes from transfers, while less than 10% comes from taxes.
Table 1 Government redistribution by world region: The dominant role of transfers

3) Redistribution rises with development, but only because of transfers
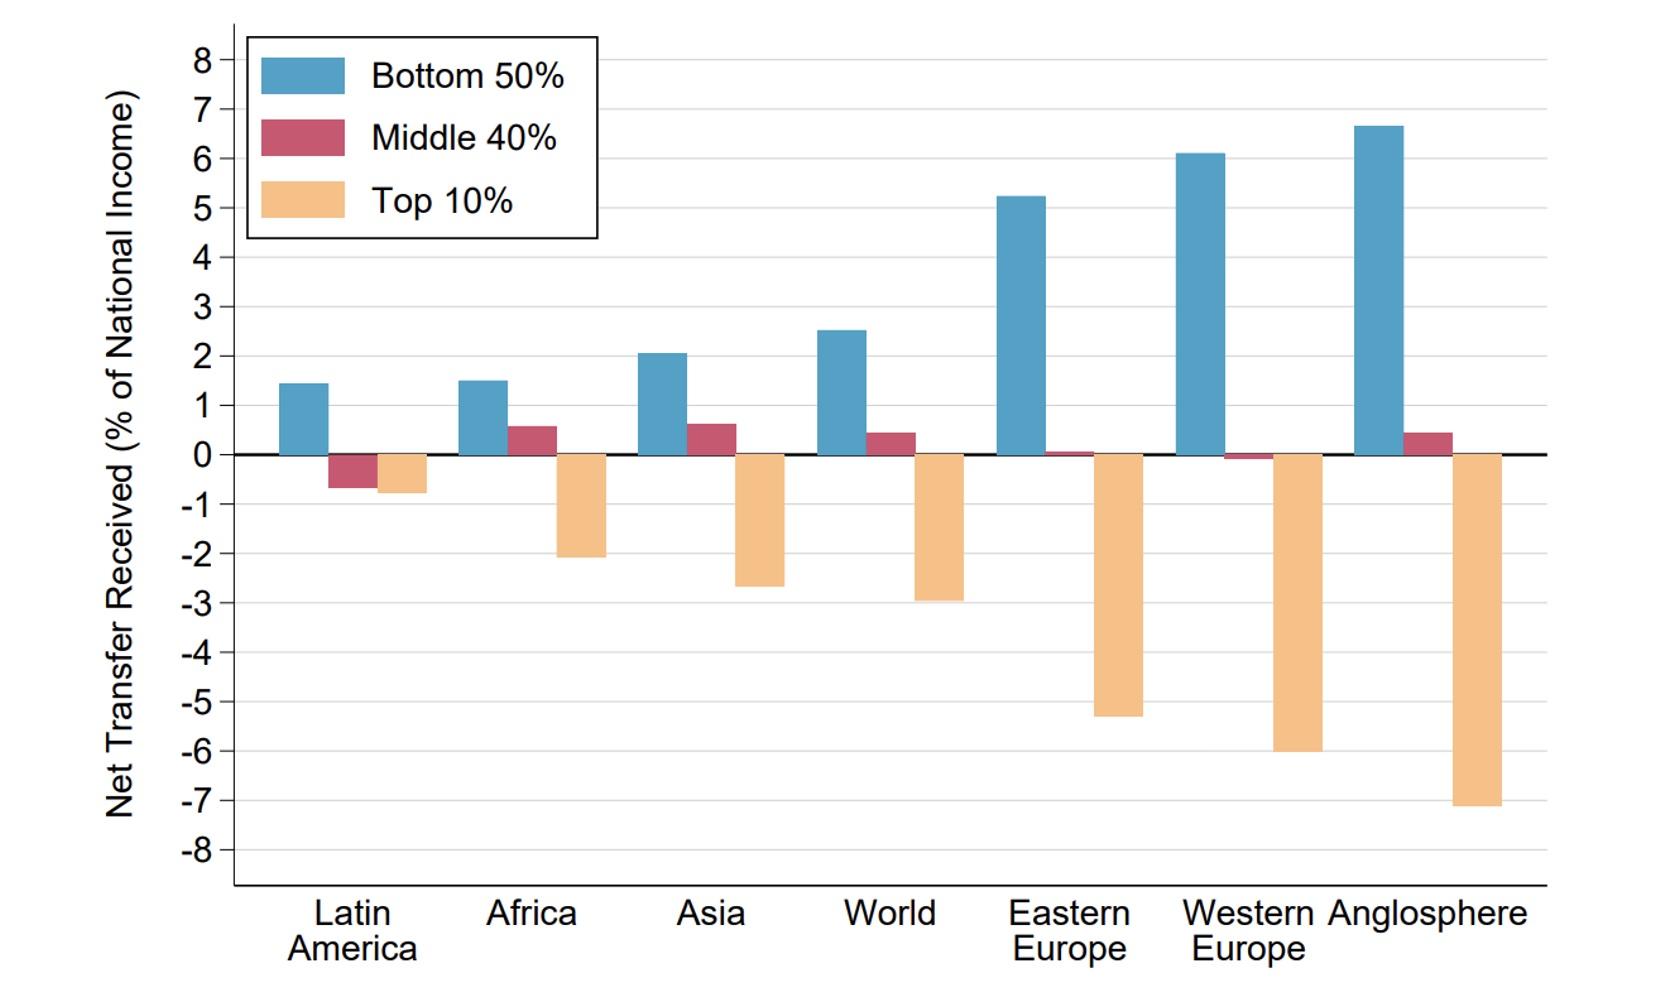
Redistribution rises with development, but this is entirely due to transfers. Tax progressivity is uncorrelated with per capita income, despite noticeable regional patterns. For instance, Western European and Anglosphere countries have slightly progressive tax systems, while the distribution of taxes is strongly regressive in Eastern Europe and Latin America, mainly due to the prevalence of high indirect taxes and less progressive personal income taxes. In contrast, the impact of transfers on inequality rises sharply with development. This finding mainly arises from the fact that high-income countries spend more on cash and in-kind transfers, but can also be explained by their greater reliance on more progressive forms of public spending – in particular, social assistance and healthcare. In the average African country, less than 2% of national income is transferred to the poorest 50% of the population in the form of government transfers, compared to over 6% in Europe and the US (see Figure 2).
Figure 2 Net transfers operated by the tax-and-transfer system, between pre-tax income groups, 2019

4) There has been no cross-country convergence in redistribution
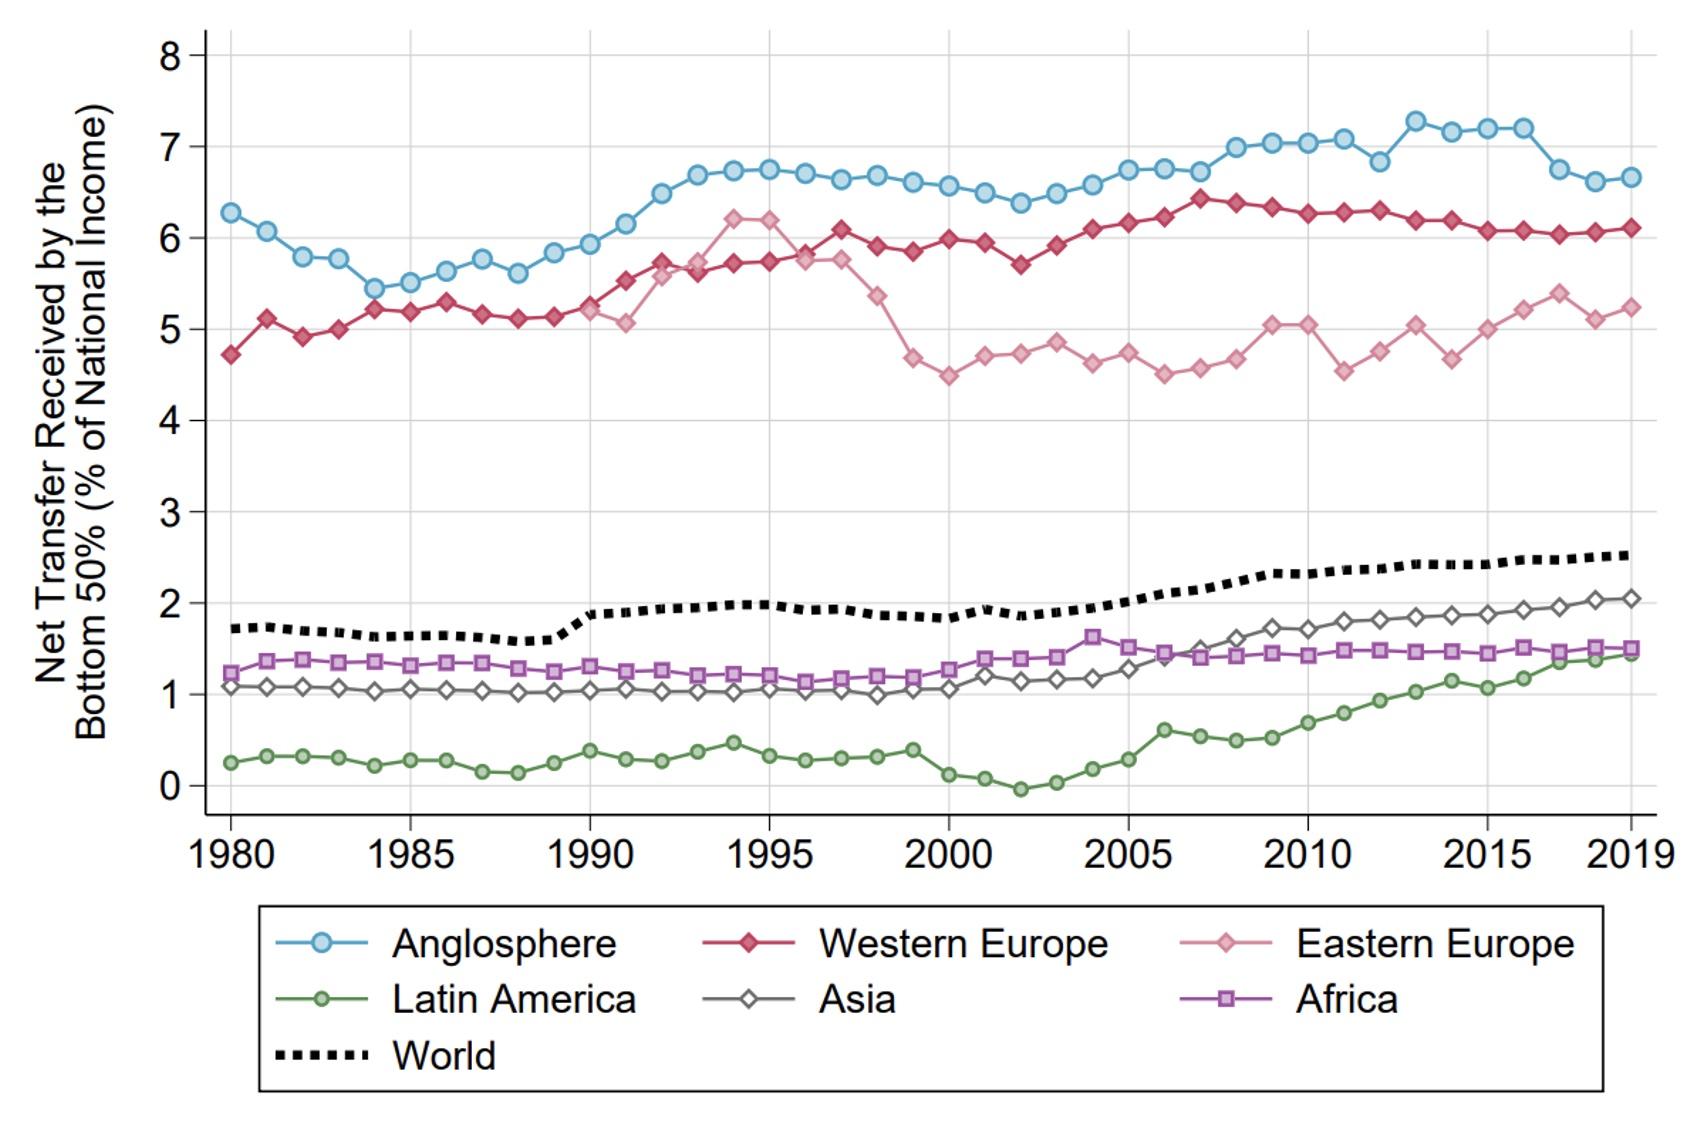
There has been no cross-country convergence in redistribution. The net transfer received by the bottom 50% has increased slightly in the average country, from about 2% to 2.5% (see Figure 3). However, this average figure masks considerable heterogeneity. Redistribution has risen significantly in Western Europe and Latin America, while it has stagnated in Eastern Europe and Africa. The gap in redistribution between low- and high-income countries has remained about the same. Upper-middle-income countries have caught up with high-income countries, but this is mainly due to the rise of fiscal progressivity in China.
Figure 3 Extent of redistribution by world region, 1980-2019: Net transfer received by the bottom 50% (% of national income)

5) Predistribution dominates redistribution
Despite large cross-country differences in tax-and-transfer systems, variations in inequality are primarily driven by differences in pre-tax inequality (predistribution) rather than by variations in taxes and transfers (redistribution). In line with existing work focusing on Europe and the US (Blanchet et al. 2022, Bozio et al. 2018), we find that countries displaying the highest levels of pretax inequality also end up displaying the highest levels of post-tax inequality (see Figure 4). By our estimates, predistribution accounts for over 80% of cross-country variations in inequality, while redistribution accounts for less than 20%.
Figure 4 Predistribution versus redistribution: Bottom 50% pre-tax versus post-tax national income shares by country, 2019

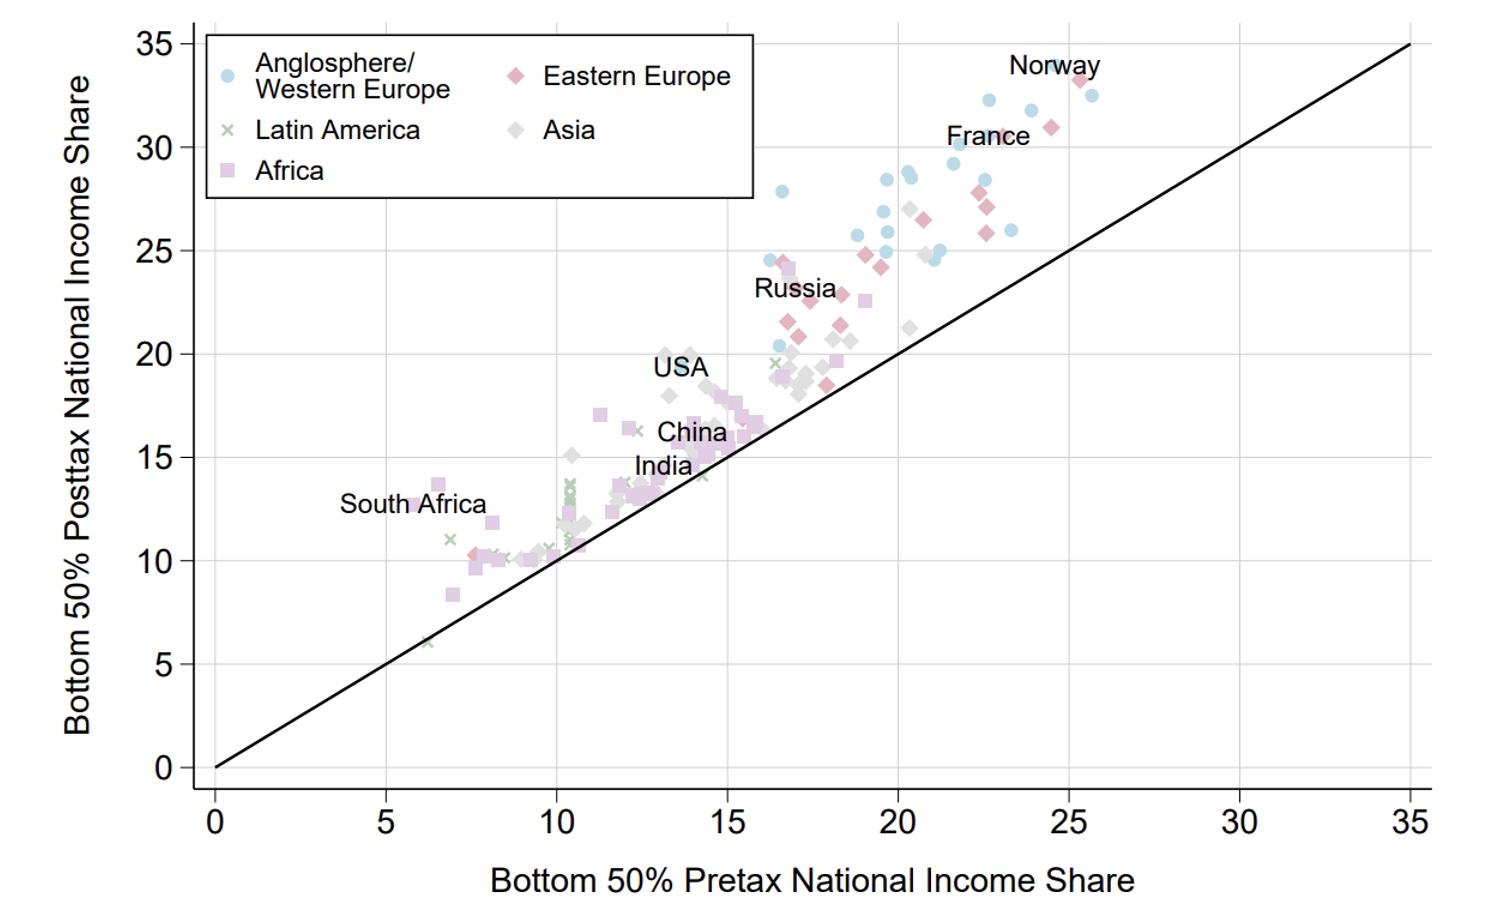
We do find a strong correlation between predistribution and redistribution, however: Countries with more progressive tax-and-transfer systems display lower levels of pre-tax inequality. This suggests that while the direct effect of taxes and transfers explains little of the variation in post-tax inequality, redistributive policies might still play an important role in indirectly shaping the distribution of market incomes.
Conclusion
By building and analysing new estimates on government redistribution worldwide, we have uncovered a number of new results on the evolution of fiscal progressivity around the world since 1980. While most tax systems appear to be essentially flat, transfers are strongly progressive, implying that tax-and-transfer systems almost always reduce inequality. They do so much more in high-income than in low-income countries, however, mainly because the former display larger welfare states, but also because they better target government transfers towards low-income households. There has been no cross-country convergence in government redistribution in the past decades. As a result, taxes and transfers have done little to change the global picture of inequality across countries.
Redistribution is often mentioned as a key lever of inequality reduction, yet the bulk of cross-country differences in inequality appear to be explained by differences in the distribution of pre-tax incomes, not redistribution. This fact calls for much more research on the drivers of pre-tax inequality. On the one hand, taxes and transfers could play a key role in indirectly shaping the distribution of pre-tax incomes. On the other hand, other ‘predistribution’ policies, such as education or labour market regulation, could hold more importance in explaining why some countries are more unequal than others. Distinguishing between these two alternative explanations provides important avenues for policy and future research.
Source : VOXeu


