


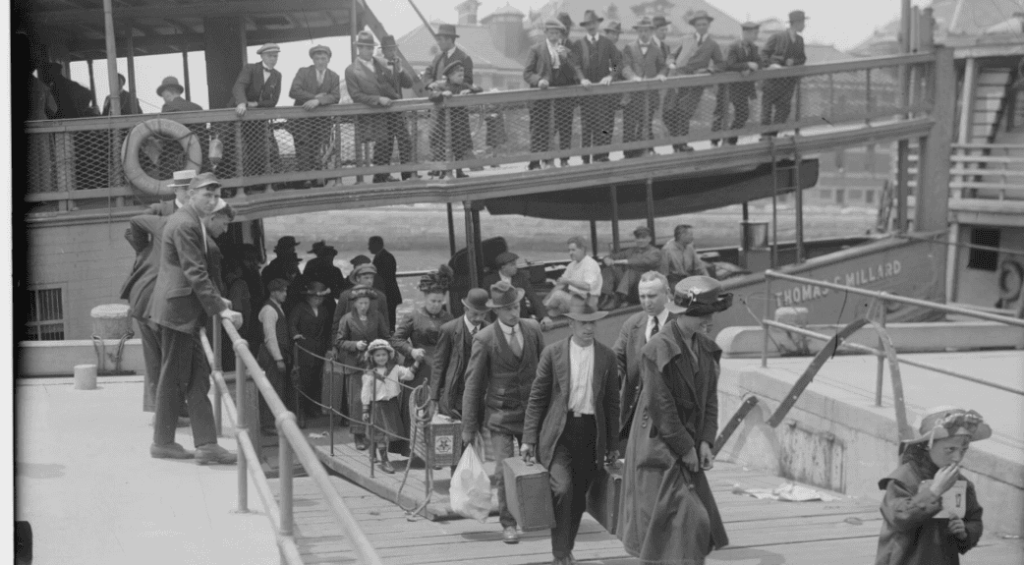
US net migration turned negative in 2025 following a sharp tightening of immigration policies. This column turns to the Age of Mass Migration and the sharp policy reversal of the 1921 and 1924 Quota Acts to examine how immigration shapes long-run growth through its contribution to innovation. The authors find that without the Age of Mass Migration, US GDP per capita would have been 8.2% lower by 1940, while the policy that ended mass migration harmed the US comparatively little. They also demonstrate the importance of geography: the impact of immigration on productivity depends not only on how many arrive and how skilled they are, but also where they settle.
Immigration policy is once again at the centre of economic debate. For the first time in over half a century, US net migration turned negative in 2025 following a sharp tightening of immigration policies. Early estimates associate this shift with modestly slower GDP growth – around 0.2 percentage points that year – largely through a smaller labour force (Edelberg et al. 2026). In Europe, debates around skilled migration, refugee integration, and demographic decline are equally intense (Caselli et al. 2024, Frattini and Bouchlaghem 2026). These debates turn on a hard question: how does immigration shape long-run growth, and through which channels?
To study this question, we have to turn to historical experiences: the long-run effects at the centre of today’s debate take decades to surface, and recent inflows are simply too recent to reveal such effects. But as it turns out, the US has run this experiment before, and we can now see how it turned out. Between 1880 and 1920, during the so-called Age of Mass Migration, more than 20 million immigrants arrived; then, in a sharp policy reversal that prefigures today’s, the 1921 and 1924 Quota Acts cut international inflows and kept borders shut for a generation. That sequence – a vast inflow followed by an abrupt stop – is a natural experiment, one that lets economists trace how immigration, and its restriction, shaped the US economy and may shed light on current debates over immigration’s relationship to economic growth.
In Arkolakis et al. (2026), we study the long-term effects of these policy choices by using a quantitative model, and two findings sit uneasily together. The Age of Mass Migration was worth a great deal: without it, US GDP per capita would have been 8.2% lower by 1940. Yet the policy that ended mass migration harmed the US comparatively little: lifting the quotas over the 1930–1960 period would have raised GDP per capita by only about 1.7% by 2000. Immigration mattered enormously; restricting it, on this margin, mattered far less. Both results come from the same model. Reconciling them cannot be done by simply counting arrivals – counting arrivals is what makes the two look contradictory. The key to reconciling them is to take seriously the role of skills and space: what talents did immigrants bring and where did they settle within the US?
That immigrants contributed to American innovation is not in doubt. During the Age of Mass Migration they accounted for nearly a fifth of all US inventors, émigré scientists reshaped entire fields, and the regions that received them prospered for generations (Akcigit et al. 2017, Grigsby et al. 2017, Moser et al. 2014, Becker et al. 2023, 2024, Qian et al. 2017). Cutting immigration off ran the other way: the 1920s quotas sharply reduced invention in the fields that had leaned on Southern and Eastern European arrivals (Moser et al. 2025). What none of these studies settles is how large immigration’s contribution to aggregate growth actually was.
In our work, we construct a novel micro dataset to answer this question. We link the universe of US patents granted between 1880 and 1930 to individual census records and augment these data with millions of original immigration records from the Castle Garden database and the Hamburg Passenger Lists, which we obtained through separate cooperation agreements with the data providers. Combining these records with multiple waves of census data allows us to observe occupation before and after immigration, as well as where in the US an immigrant first settled and later moved to.
Immigrants as urban innovators
The most striking of our findings is also the least studied: the importance of geography. Like today, invention between 1880 and 1920 was extraordinarily concentrated in a handful of urban hubs, such as New York, Chicago, and Philadelphia. Those large cities were also where immigrants tended to settle. As such, the spatial concentration of immigrants within the US was a crucial aspect of their economic contribution: when invention is this unevenly spread, immigrants’ role for aggregate growth depends not only on how many arrived and how skilled they were, but on where they went – a channel the debate over numbers and skills misses entirely.
Figure 1 shows the quantitative importance of the concentration of both innovation and immigrants in cities. Patenting in cities ran four to five times the rural rate, and immigrants agglomerated in those, hubs while natives were far more dispersed. Counties in the highest urbanisation quintile were almost 40% foreign-born; in rural counties, the share was under 10%. On average, immigrants and natives are roughly equally innovative, with around two patent holders per thousand people in both groups. However, within any given location, immigrants were only half as likely as natives to hold a patent. Both facts are true, and geography explains why: immigrants, by settling in urban innovation hubs, had access to the ideas and spillovers that cities provide.
Figure 1 Immigrants and innovation in 1910


Notes: Panel (A) shows the number of natives and immigrants holding at least one patent, per 1,000 individuals. Panel (B) shows patents per capita and the immigrant share across counties by quintile of urbanisation, each indexed to 100 in the least-urban quintile. Patents per capita are computed from the full population of geolocalised patents, not the subset matched to the US Census, so the urban gradient does not reflect differences in match rates.
Source: Arkolakis et al. (2026).
In addition, immigrants’ innate skills also mattered hugely. Patenting rates varied sharply across nationalities. British immigrants patented at higher rates than natives, while Italian and Irish immigrants patented at markedly lower rates. The immigration records show these gaps are consistent with immigrants’ pre-migration occupations: British and German arrivals were far more likely to have held skilled occupations before their departure.
The aggregate consequences of immigration
To quantify how these patterns shaped US growth, we bring our data to a spatial semi-endogenous growth model in which immigrants influence local innovation, sort across locations, and generate knowledge spillovers that propagate through trade and mobility linkages. The mechanism is one of market size: a larger and more skilled local workforce raises the return to developing a new idea, so immigrants contribute to innovation directly, but also indirectly by increasing incentives for the incumbent workforce. Trade linkages and internal migration then transmit these local gains – or losses – to other regions, and urban innovation hubs emerge as centres of knowledge production.
Our headline counterfactual is a full stop to immigration between 1880 and 1920. Absent this migration wave, US GDP per capita would have been 8.2% lower by 1940. Moreover, the absence casts a long-lasting shadow: the ideas those missing cohorts would have produced are never fully recovered, and US GDP per capita would have been 9.6% lower by 2000. A large part of this effect can be explained by the skills that immigrants brought. Had all immigrants been unskilled and not participated in the innovation process, GDP per capita would still have been about 5.9% lower by 1940 – roughly three-quarters of the full effect (Figure 2). What makes this finding striking is how few people it involves: only a small minority of immigrants ever patented, and yet that minority accounts for most of the aggregate result.
Figure 2 The aggregate impact of international migration


Notes: The figure shows aggregate GDP per capita relative to the baseline economy. Total effect sets international migration to zero between 1880 and 1920. Skills holds the number of arrivals fixed but assumes all are unskilled. Space holds both the number and the skill content of arrivals fixed, but assumes they settle in proportion to the native-born and place no particular value on urban amenities.
Source: Arkolakis et al. (2026).
At the same time, immigrants’ sorting into urban hubs also had large aggregate effects. To isolate this spatial channel, we conduct a very specific counterfactual: what if the same number of immigrants, with the same skills, had arrived between 1880 and 1920 but settled in proportion to the native-born, without any particular preference for cities? Over the first three decades of this episode, this costs about as much as stripping immigrants of their skills entirely. Where immigrants settled was as important for US growth as what they brought. The reason is simple. Innovation depends on the local knowledge stock, so the same skilled worker is more productive as an innovator in New York than in a rural area. Immigration was therefore different from other forms of population growth: it led to urbanisation. And immigration-led urbanisation was itself a source of growth.
Interestingly, over time, the two channels part company. By 1940, the spatial effect has fallen to around 1%, against 5.9% for skills (Figure 2). The reason is not that geography stopped mattering, but that immigrants moved. By contrast, skill that never arrived is a skill that is never supplied.
Revisiting the 1920s quotas
We then use this framework to study the immigration restrictions of the 1920s. The 1921 and 1924 restrictions were actually enacted, not a modelling scenario. We use our model to ask what lifting them over the 1930–1960 quota period would have done. Holding the total inflow at its 1910–1920 average and apportioning the additional arrivals between the two restricted groups – Southern and Eastern Europeans, and Asians – US GDP per capita would have been only about 1.7% higher by 2000. That is a fraction of the growth that the Age of Mass Migration itself generated.
Two things account for the gap. The additional inflow is large in absolute numbers, but small against a US population by then far bigger than in 1880. Hence, the implied change in population growth was more modest. Moreover, the groups the quotas excluded were, on average, substantially less skilled than natives. As such, the policy cut hardest on the margin our estimated model finds least productive.
Implications for today’s debates
Our estimates are for a particular episode, and the parameters that govern them – how concentrated innovation is, how strongly immigrants sort towards hubs, how far knowledge spills across places – are historical. Whether they hold today is an empirical question we do not settle here. We do, however, believe that the economic mechanisms we highlight are as relevant today as they were 100 years ago: wherever innovation is spatially concentrated and immigrants sort unevenly across space, the aggregate effect of immigration depends not only on how many arrive and how skilled they are, but also where they settle.
The policy debate, however, rarely focuses on the latter. Europe’s current agenda illustrates the gap. The revised Blue Card and the new EU Talent Pool are built to attract skilled workers, whose contribution to growth recent cross-country evidence confirms (Basso et al. 2026). Neither says much about where those workers settle, or about the spillovers their location generates. Instruments that bear on those dimensions such as incentives to settle in particular regions or infrastructure that helps local gains spread across them (Allen and Arkolakis 2022) exist, but they are rarely discussed as innovation policy. One of the key lessons of the Age of Mass Migration is that this might be a lost opportunity.
Source : VOXeu