Throughout 2022, the weaponisation of natural gas supplies by Russia led to concerns regarding the security of natural gas supply in Europe. This column reviews the reasons behind the increases in energy prices and prospects for 2023–24. Decisive EU policy and market rebalancing helped reduce concerns about shortages, bringing prices back to physical fundamentals. Similar spikes to those experienced in the summer of 2022 are less probable in the winter of 2023–24. Managing demand, increasing diversification, and renewing focus on the security of supply remain necessary.
Throughout 2022, the weaponisation of natural gas supplies by Russia led to concerns regarding the security of the natural gas supply. Significant gas price spikes were the main contributor to the high electricity prices that had a major impact on the EU economy.
This has fuelled debates on the role of energy in the current inflationary environment (Killian and Zhou 2023), the capacity for the EU to phase out its fossil-fuel consumption from Russia (Pittel et al. 2022), and industrial competitiveness in a context of high energy prices. A renewed focus on the security of supply and access to commodities necessary for the green transition has come to the forefront (Paduano and Arezki 2022).
Natural gas as the main driver of the crisis
The 2021–2022 energy crisis was not related to the green transition. Energy prices increased due to the following reasons:
- reduction in the supply from Russia
- uncertainty and fears of shortages
- lower-than-usual hydro and nuclear electricity output in the summer, which pushed gas consumption for electricity
In 2022, Russia supplied 70 billion cubic metres (bcm) less to the EU than in 2021 (a total of 150 bcm in 2021). The EU had to change the origin of 40% of its imports, the majority by pipeline under long-term contracts. While natural gas prices over the previous decade were between €5/MWh and €35/MWh, at some point they reached levels more than ten times higher than the average prices in the previous 15 years. As the most expensive technology sets the electricity price, this led to price increases in wholesale electricity generation.
Figure 1 Russian weaponisation of gas supply and EU energy policies
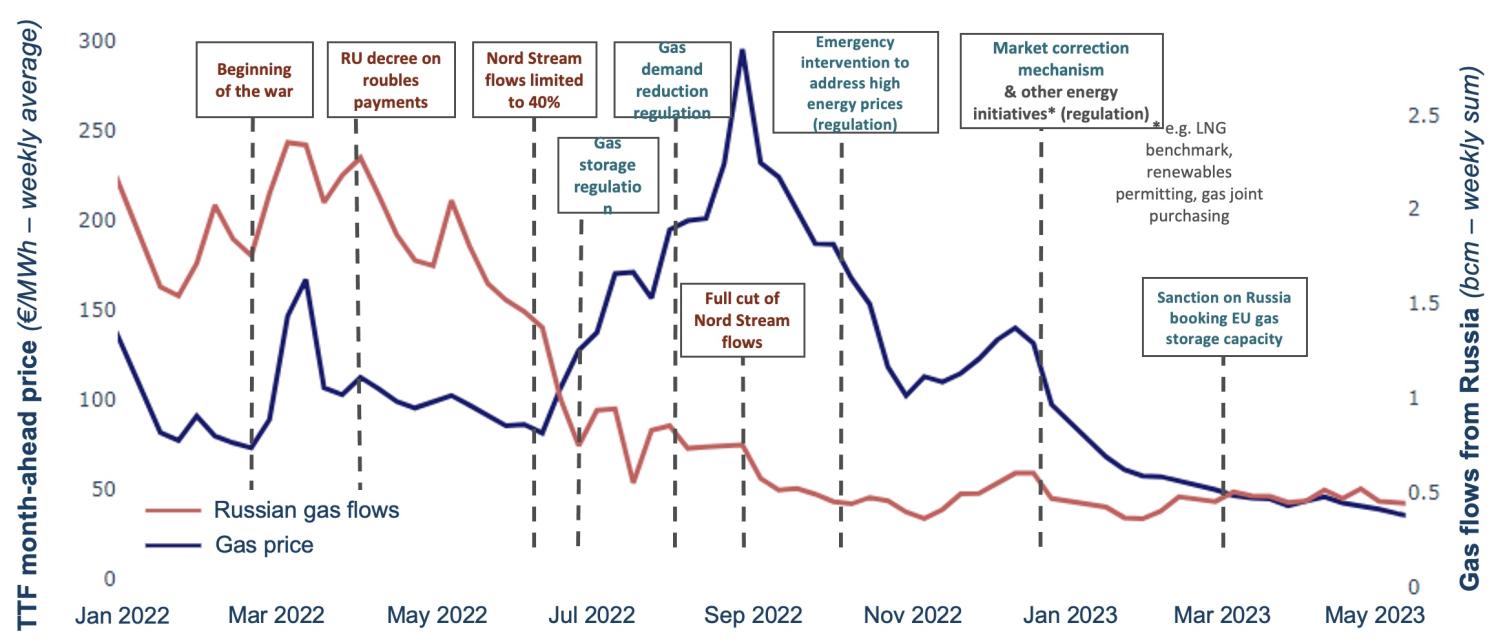

Sources: DG ENER Chief Economist Team based on ENTSO-G and Platts
Figure 2 Households’ retail prices for gas and electricity (EU average)
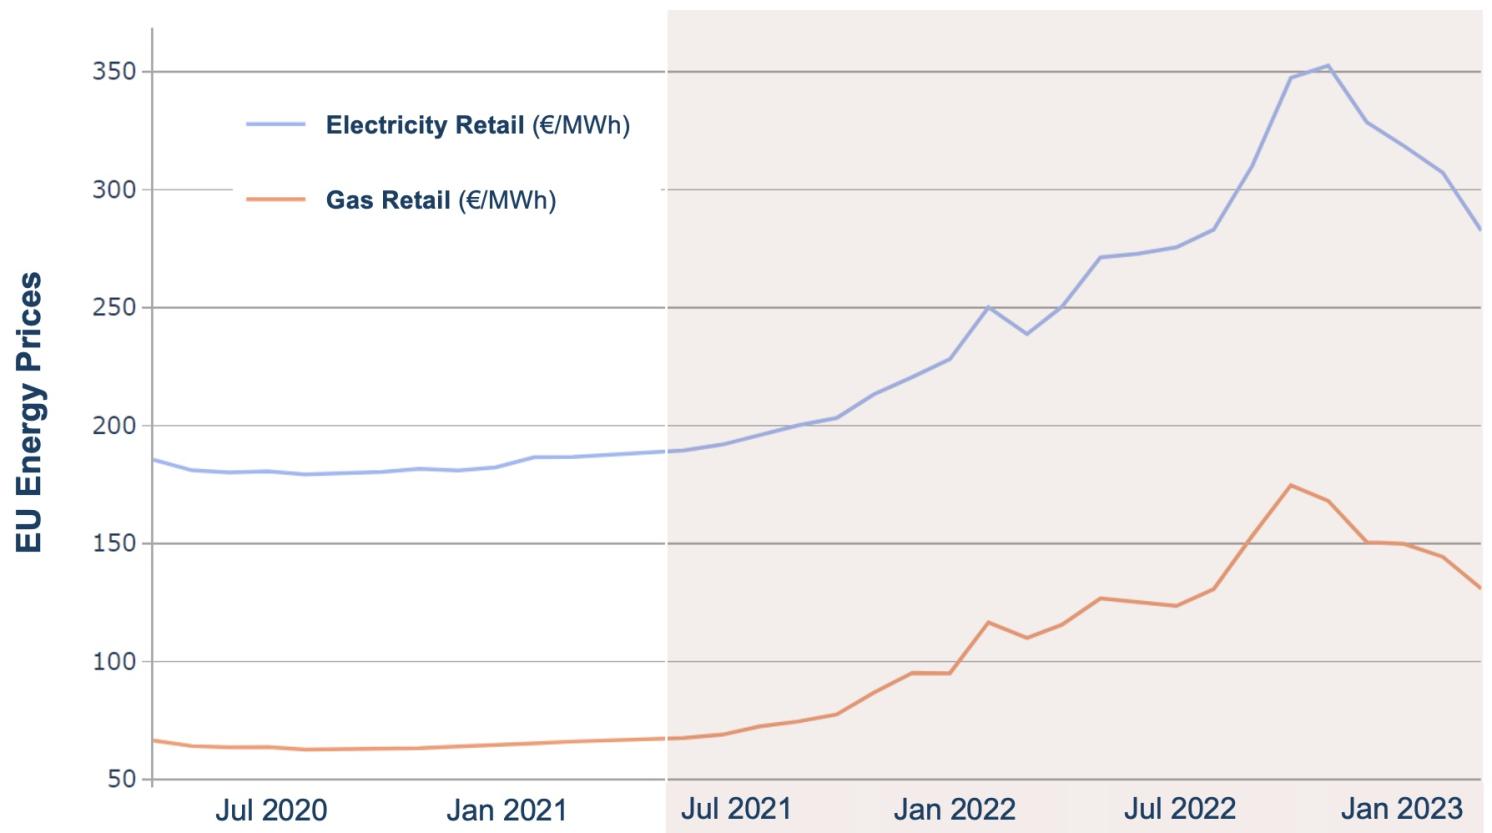
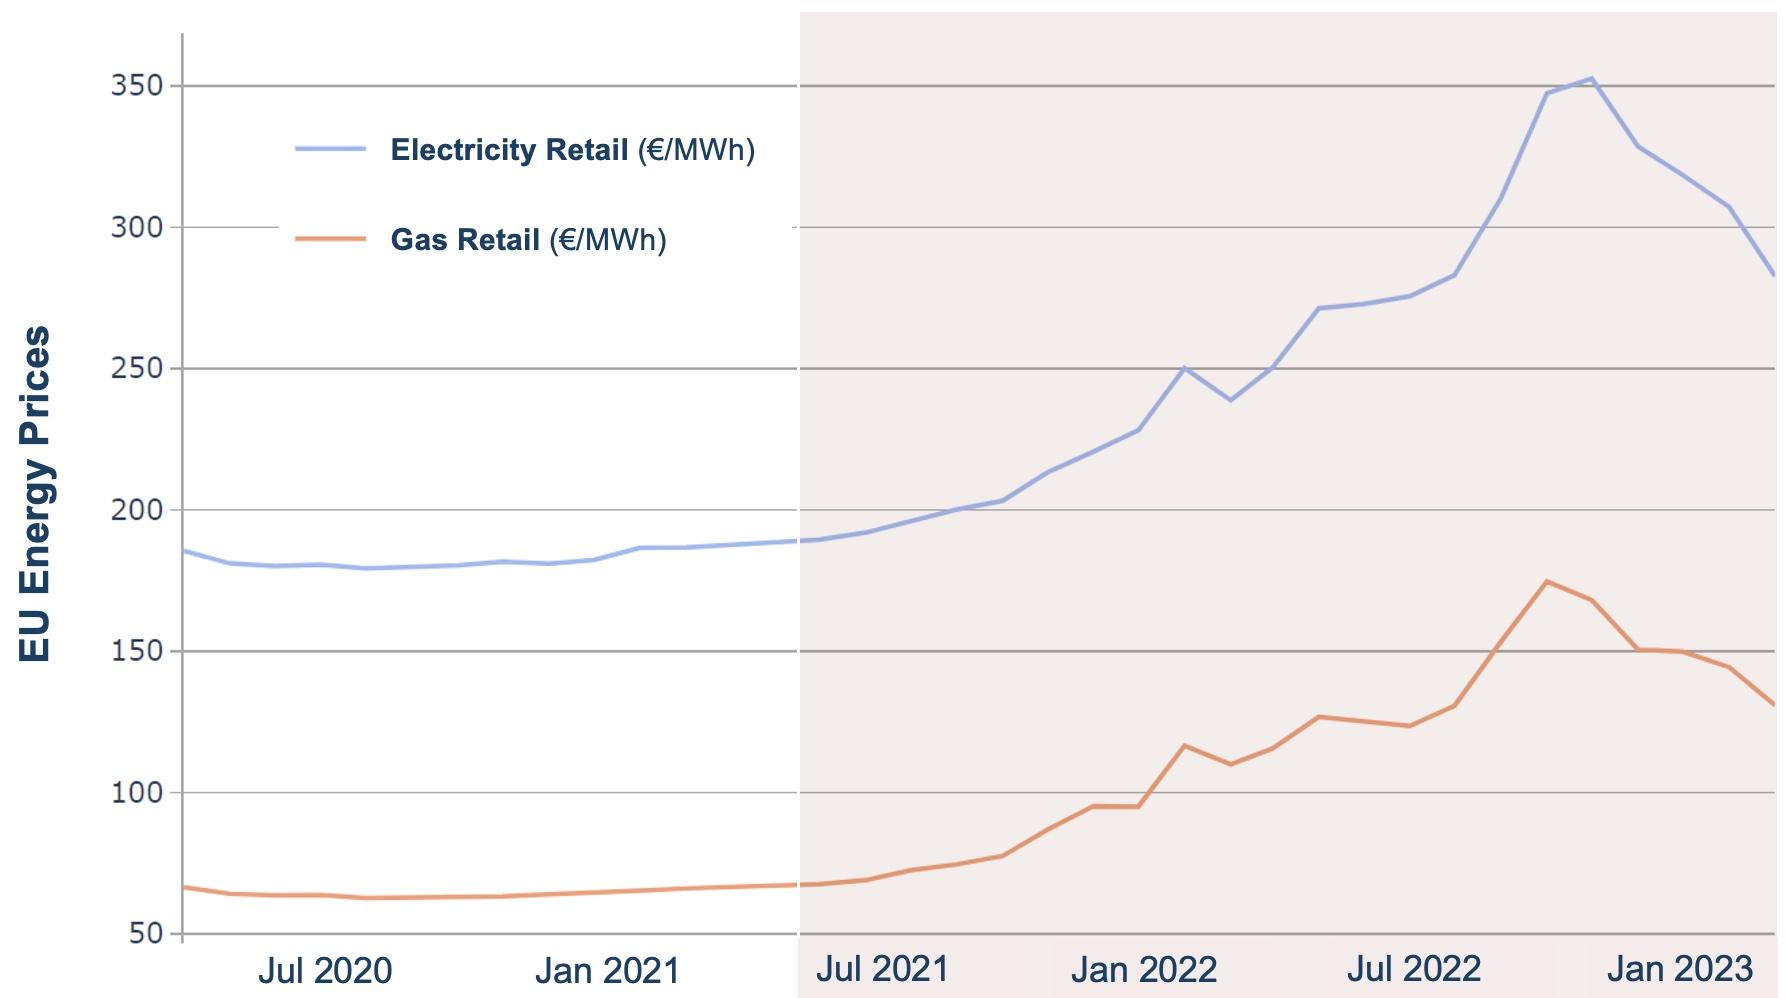
Sources: European Commission based on VaasaETT
Higher gas prices were instrumental in attracting additional LNG and reducing demand. However, extremely high prices between July and August 2022 were not necessary to increase imports due to network congestion (European Commission 2023). These prices can be attributed to intra-EU competition in the face of fears of a limited supply. Ultimately, this benefited those trading the assets and represented a significant wealth transfer (European Securities and Markets Authority 2023).
The difference between the prices of the Dutch Title Transfer Facility (TTF) and global prices like the JKM (the LNG benchmark price assessment for spot physical cargoes) amounted to around €35/MWh on average between June and August 2022. During the summer of 2022, the TTF became also detached from prices at other trading places in Europe, as well as from the price assessments by price-reporting agencies.
Figure 3 Daily day-ahead prices and LNG imports
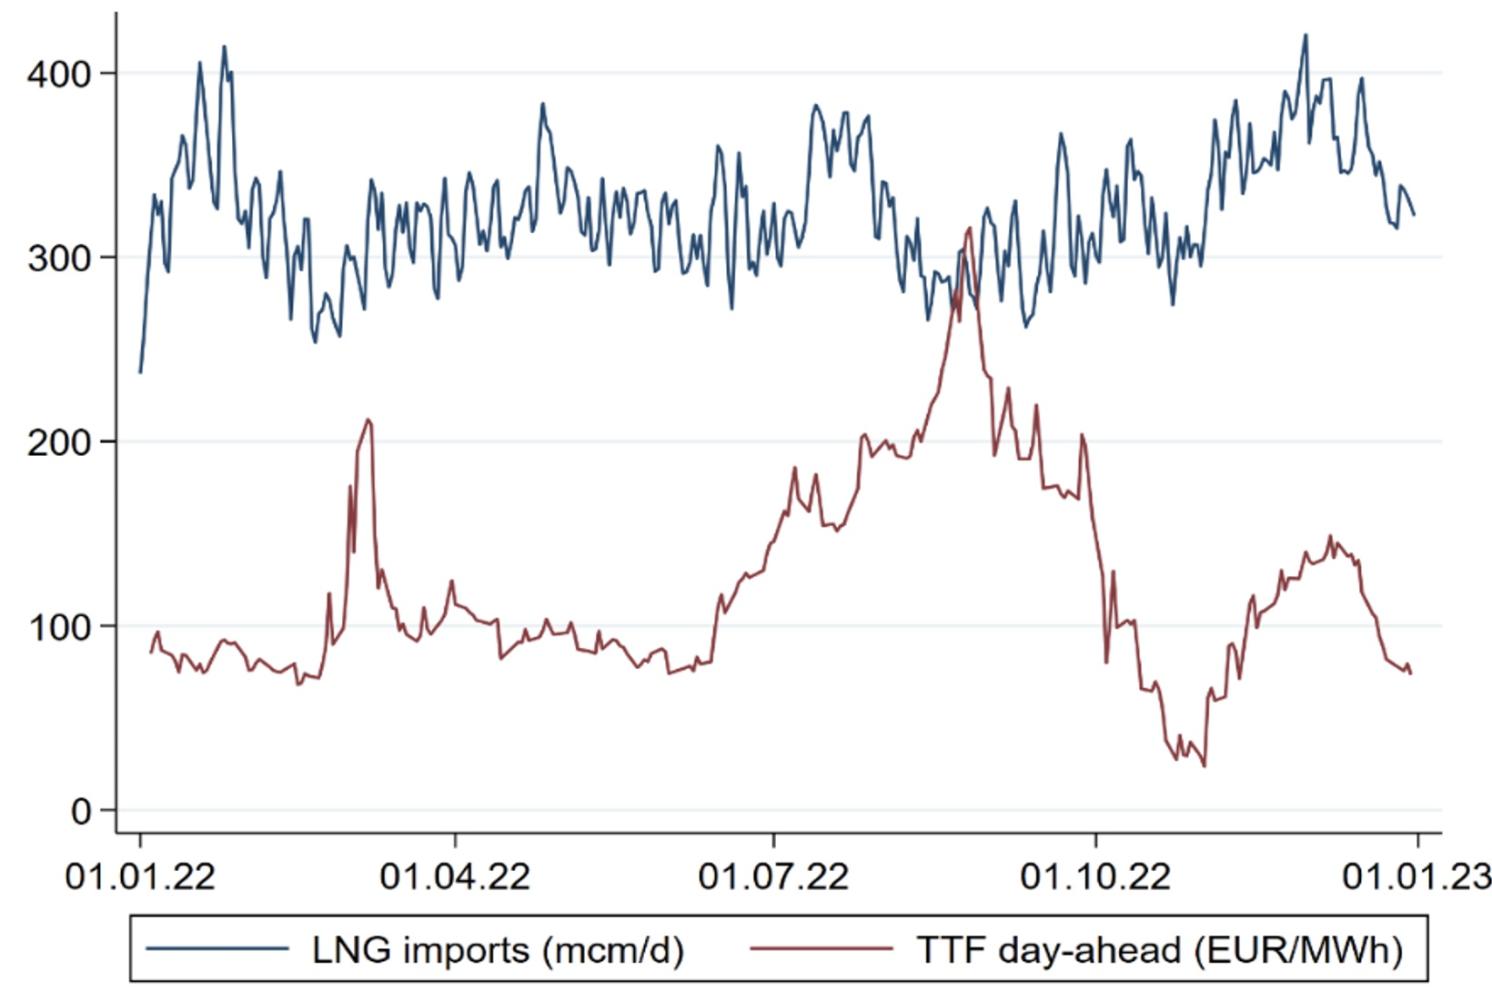

Sources: DG ENER Chief Economist Team based on ENTSO-G and Platts.
The crisis was exacerbated by the lower-than-usual hydro and nuclear output.
Figure 4 Changes in power generation in the EU between July-September 2021 and July-September 2022
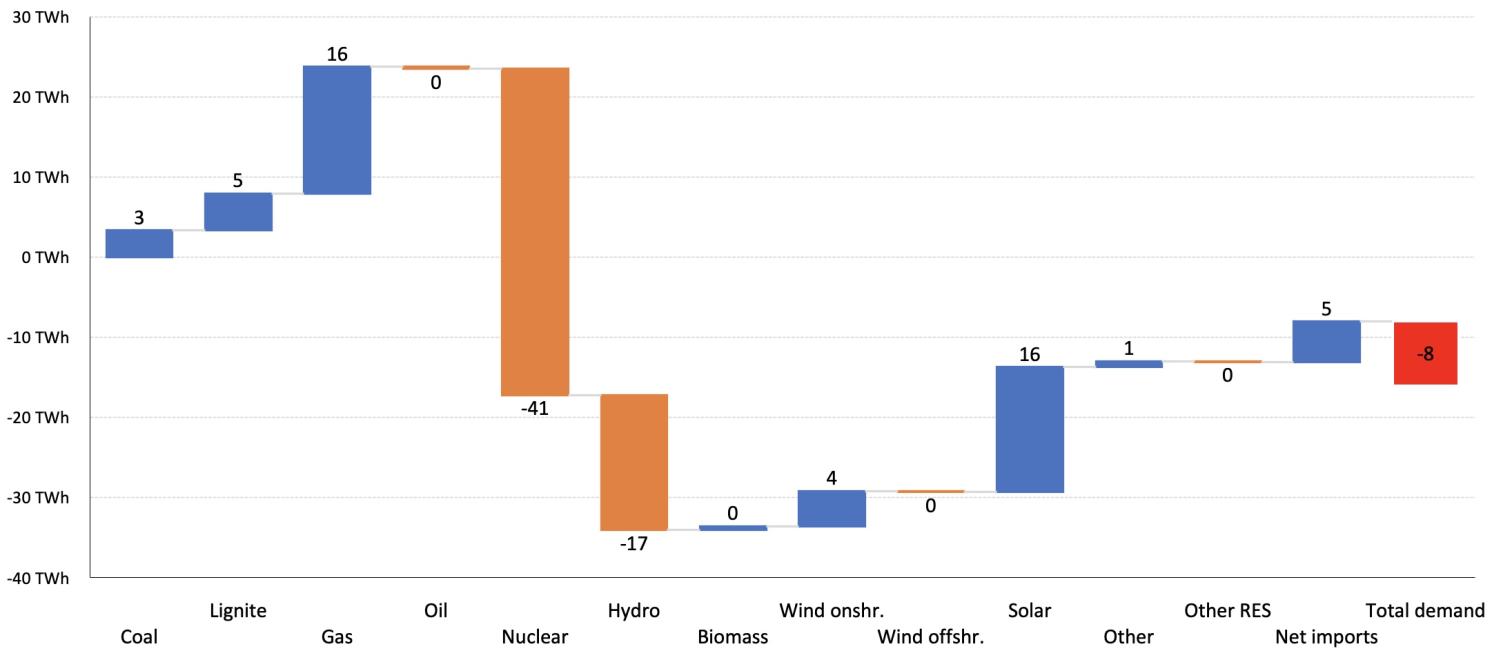

Source: DG ENER Chief Economist Team based on Eurostat and ENTSO-E
Better prospects for winter 2023–24 thanks to decisive EU policy action and market rebalancing
Decisive EU policy as outlined by the REPowerEU plan and market rebalancing helped reduce concerns about shortages, bringing prices back to physical fundamentals. Similar spikes as those experienced in the summer of 2022 are less probable next winter due to the following reasons:
- Storage levels are at historically high, at 78% as of 30 June 2023 versus 63% on average on the same day during the reference years 2016–2021 (Figure 5).
Figure 5 Evolution of European gas storages: reaching historically high levels since autumn 2022
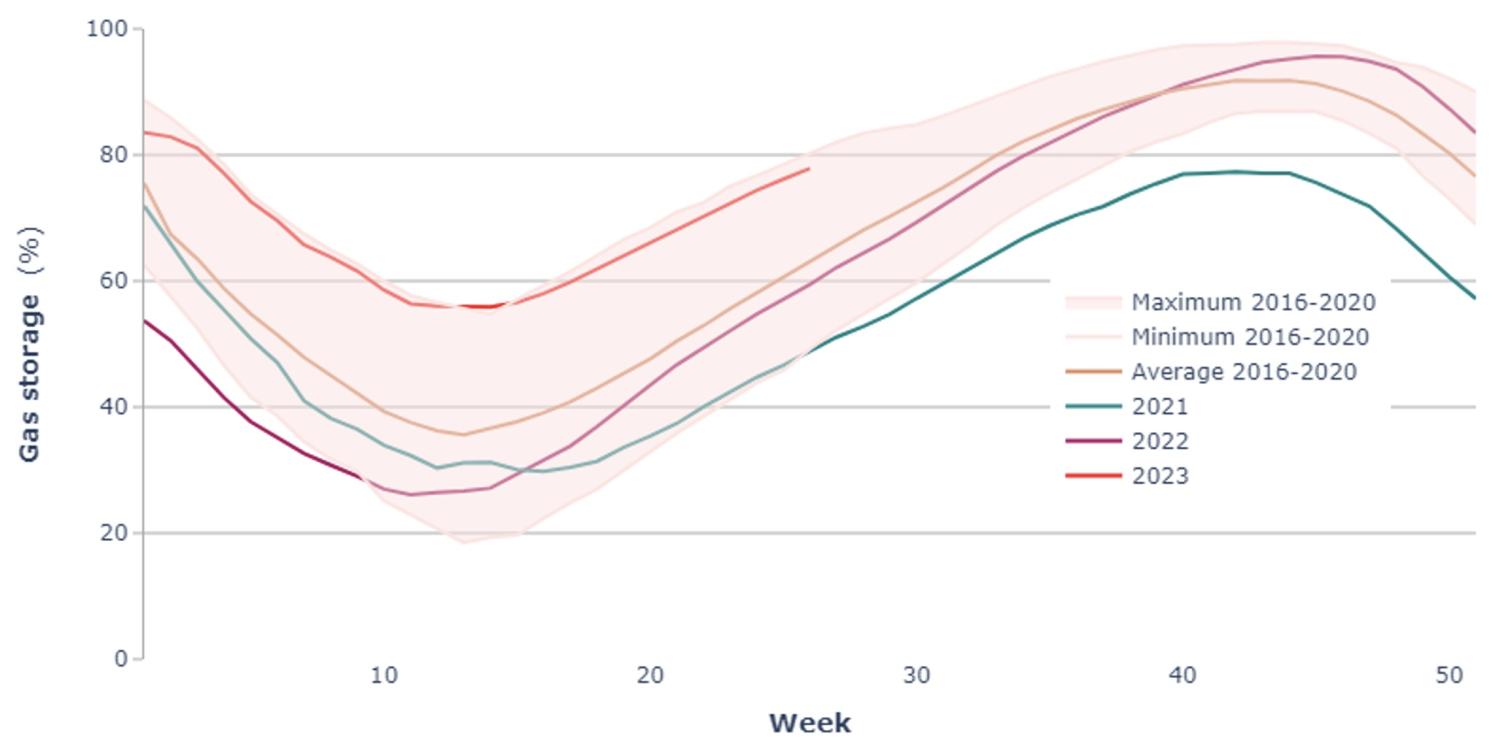

Source: European Commission based on GIE-AGSI
- Natural gas demand has gone down. Demand from August 2022 to May 2023 was 17% lower in comparison to the past five-year average (Figure 6). Part of the reduced demand last year is structural.
Figure 6 Natural gas demand reduction in Europe: Overshooting the 15% voluntary consumption reduction target

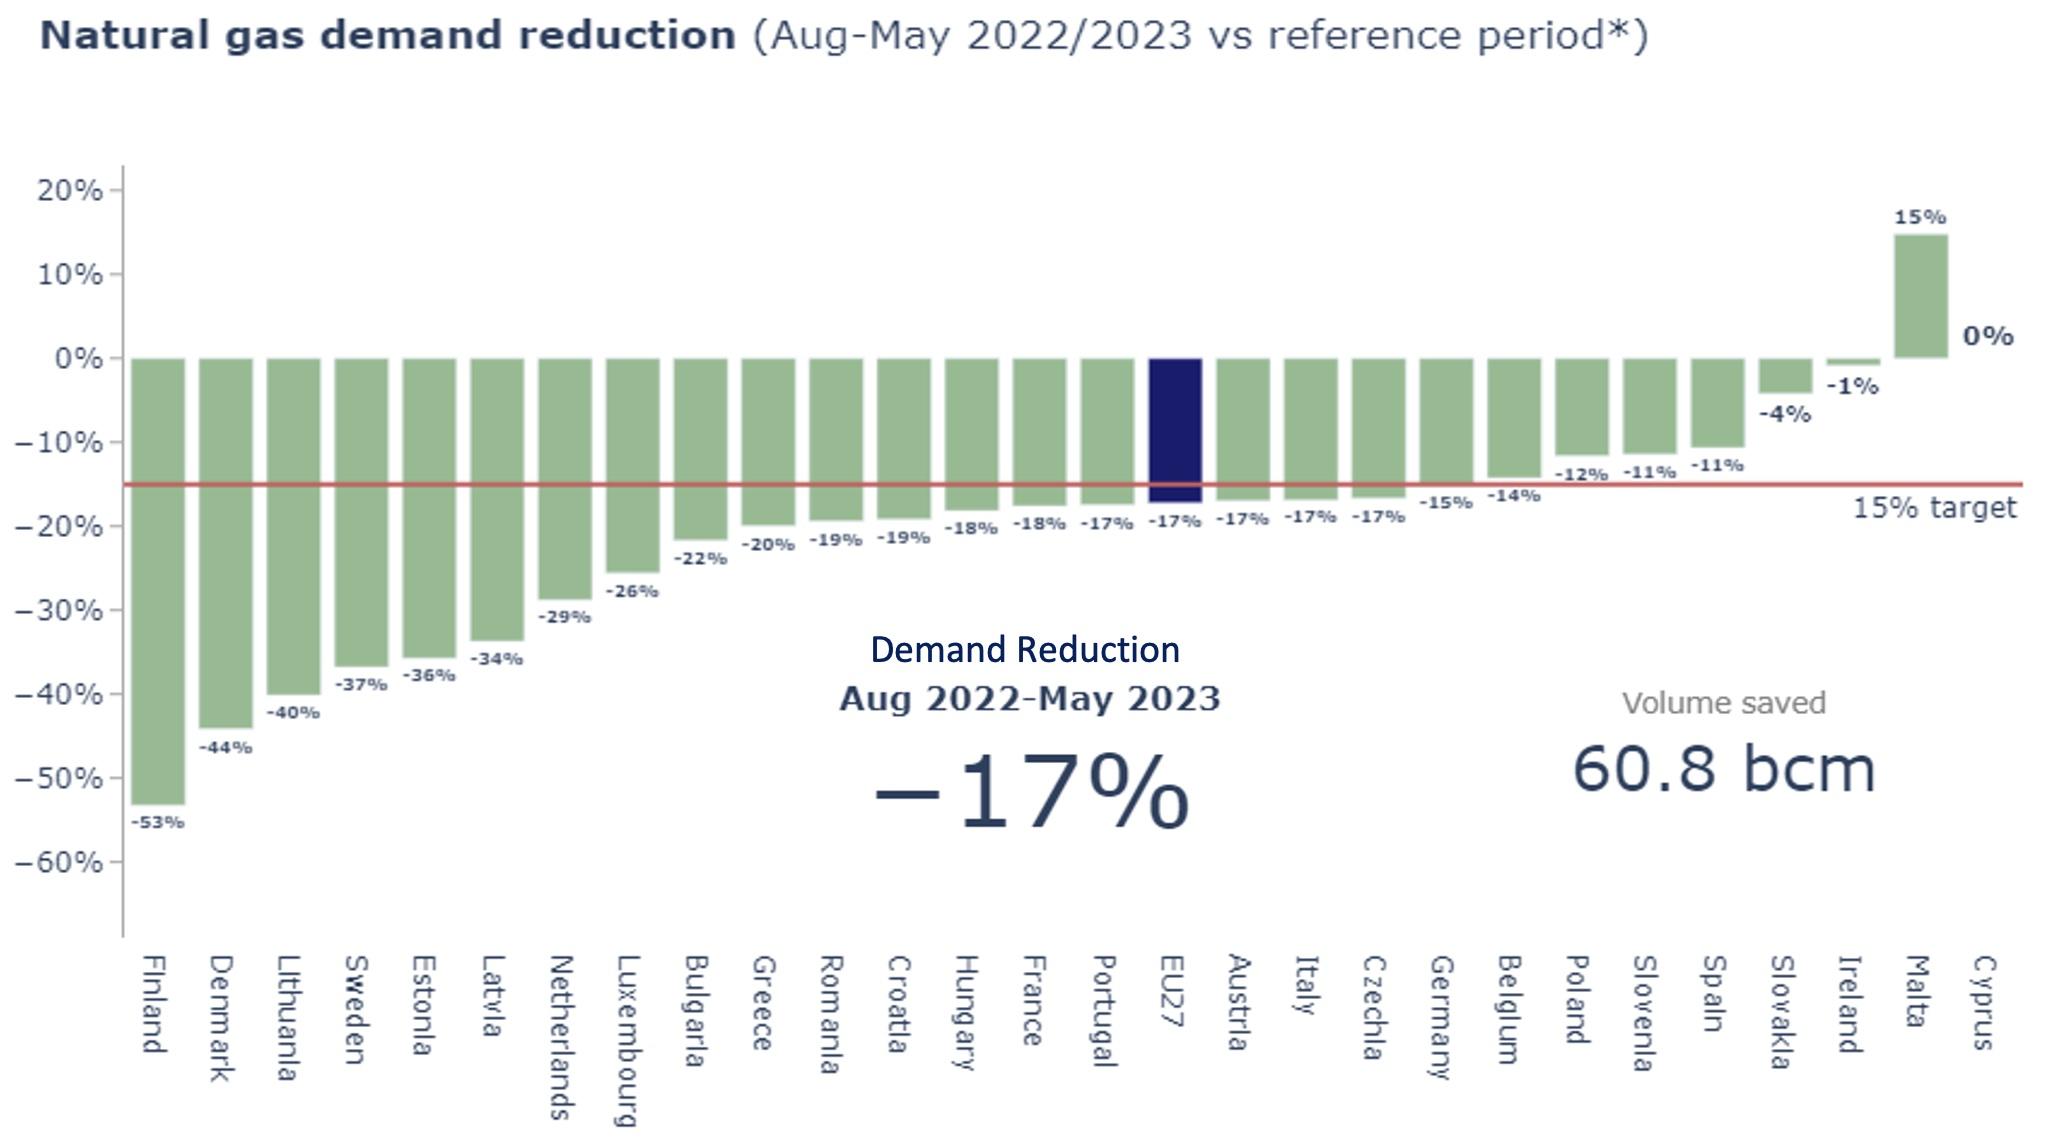
Notes: The reference period is defined as the average of the very same month of the previous 5 years. For April to December, it is 2017–2021 and January to March 2018–2022 (as laid out in the Demand Reduction Regulation).
Source: European Commission based on Eurostat.
- The EU has diversified its supply. The weaponisation of energy by Russia last year can no longer influence the market in the same way: today only about 20 bcm/year comes via pipeline from Russia, versus 155 bcm/year in the five years before 2022.
Figure 7 Increase of LNG imports in Europe

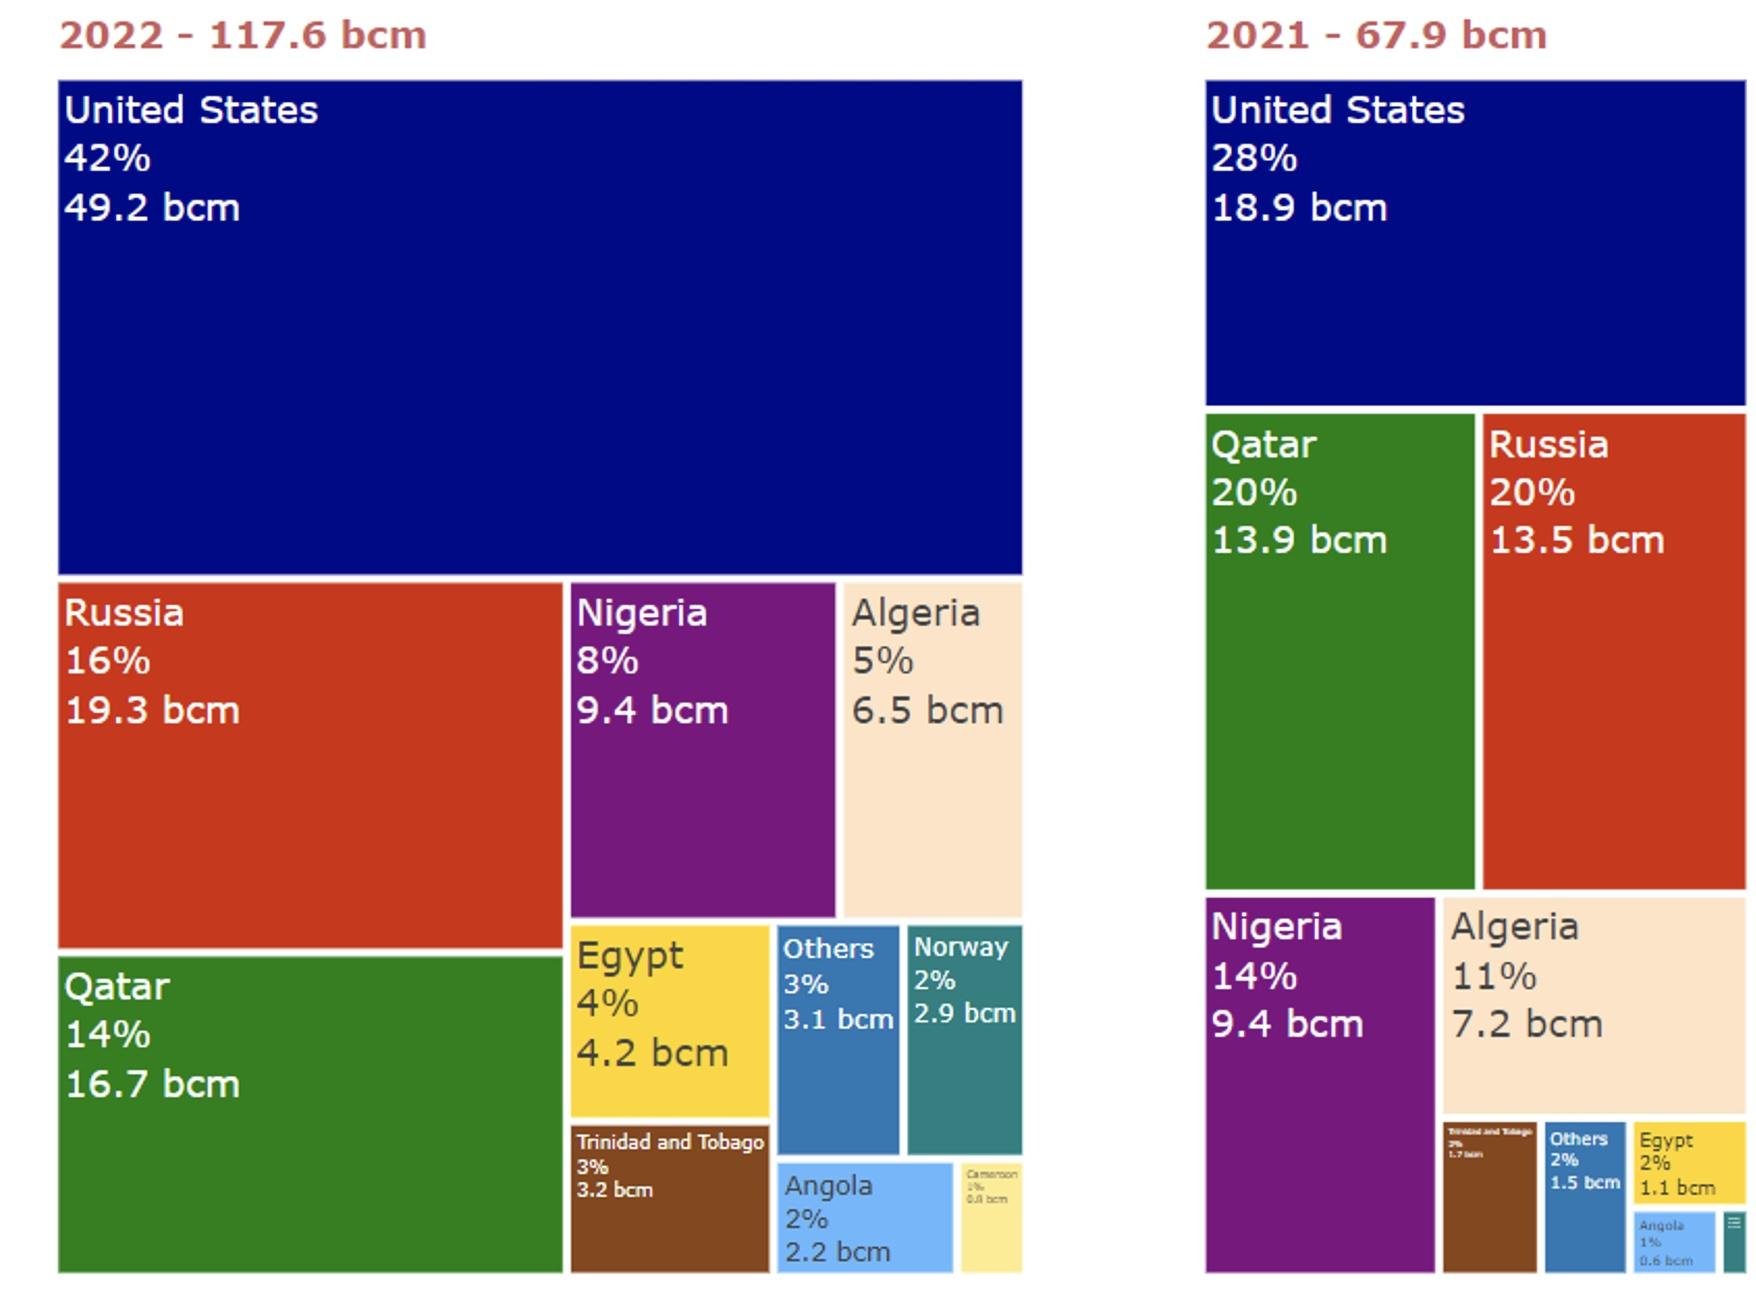
Source: European Commission based on Refinitiv
- New LNG importing terminal projects with a total capacity of around 30 bcm/year are helping the EU to secure an alternative supply. The total added capacity via FSRU and LNG is 20.6 bcm/year in operation and 49.8 bcm/year, to be commissioned.
- There is less uncertainty compared to 2022 after the efforts the EU made last year. Market players do not need to buy gas no matter the price to ensure the security of supply.
Source : VOXeu


")


")


.jpeg")


")


")


")


")
")

")