Common ownership links may reduce costs and spur innovation (e.g. Vives and Azar 2022), but they may also make firms in the same industry less competitive. In general, common ownership may lead to a failure of the competitiveness condition (Hart 1979), according to which shareholders unanimously agree on own-profit maximisation. The managers of firms with common shareholders may not simply maximise their own profit, but instead put a positive weight on the profits of competing firms. As a result, they may (partially) internalise the externalities of their strategies impose on other firms (Rotemberg 1984, Hansen and Lott 1996), which can soften product market competition.
Recent work has documented extensively the rise in common ownership over the past decades, and showed how it translates into higher profit weights attached by managers to rival firms. Backus et al. (2021) focus on large institutional shareholders of US firms and document how the profit weight increased from 0.2 in 1980 to almost 0.7 in 2017. (A weight of one would mean full potential internalisation.) Profit weights tend to be lower for European firms, but are documented to have increased more steeply (Boot et al. 2022).
Most recent work has focused on common ownership links across shareholders external to the industry, but there are industries in which cross-ownership links across shareholders internal to the industry are also important. In such cases, firms within an industry are themselves shareholders of other firms in the industry. Examples of industries in which those cross-ownership links are important include automobiles (Neto et al. 2020), banking (Termushoev and Stakhovych 2019), media (Ferguson 1983), electric power (Amundsen and Bergman 2002) and insurance (La Porta et al. 1999). Cross-ownership links can directly reduce the incentives to compete, but they can also reinforce common ownership links along two dimensions:
- cross-ownership links raise the profit weights that managers attach to rivals due to common ownership;
- cross-ownership links create positive profit weights to firms for which there were no common ownership links.
In our recent research (Huse et al. 2022), we examine ownership links in the global automobile market, taking into account the reinforcement effects of cross-ownership. This is an industry characterised by a non-trivial number of cross-ownership links, some of them lasting for decades and often motivated as a way to reduce development costs of new products and promote the rate of innovation.
The evolution of cross-ownership links
Figure 1 shows the evolution of the number of pairwise cross-ownership links in the automobile industry since 2007. In each year, there have been between 8 and 14 such links. The rise and fall of cross-ownership links in the first part of the sample may be partly attributed to the financial crisis and the subsequent recovery. The increase in the later years may be attributed to the new challenges facing the industry, such as the development of electric mobility (Automotive New Europe 2018).
Figure 1 Evolution of cross-ownership links in the global automobile industry

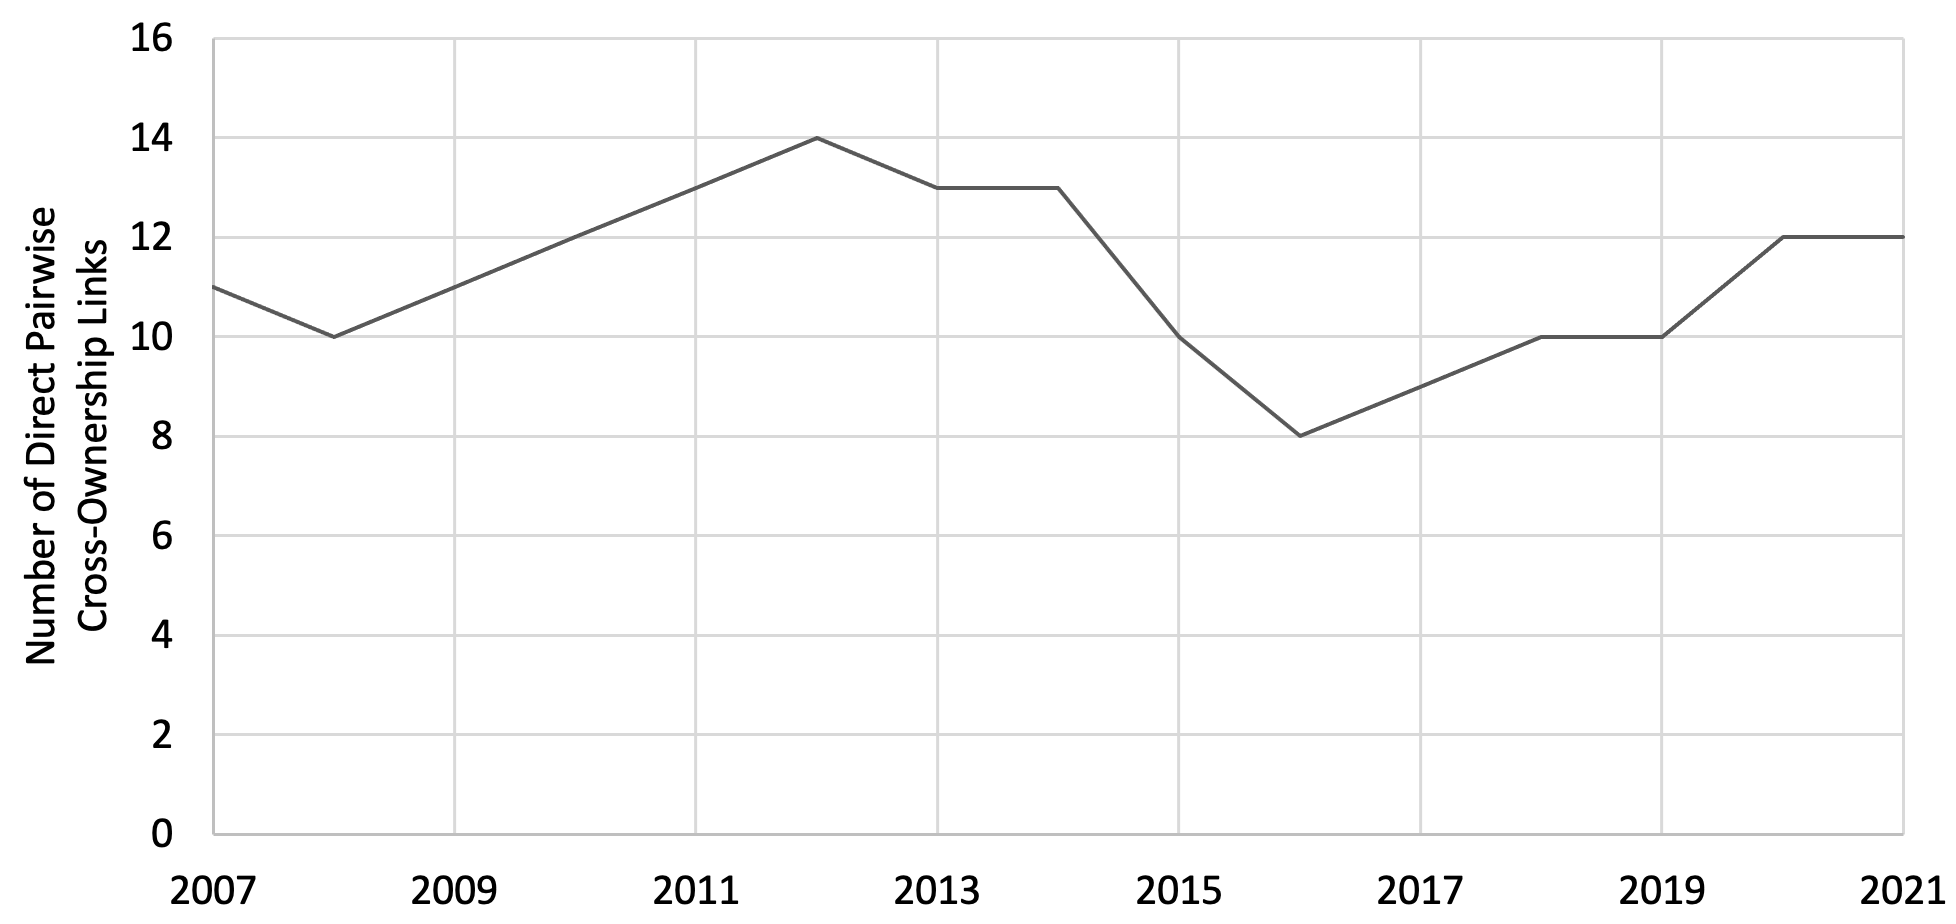
Source: Refinitiv Eikon and own calculations
Figure 2 shows the average fraction of the financial rights held by the large institutional and non-institutional shareholders in our sample, and the breakdown by type of shareholders. 1 The large shareholders hold on average 64%–68% of the financial rights in the average automobile manufacturer’s stock. Between 19% and 26% are held by external non-common shareholders, 31%–40% are held by external common shareholders (reflecting common ownership), and 5%–9% are held by internal shareholders (reflecting cross-ownership).
Figure 2 Evolution of financial rights held by large shareholders in automobile manufacturers’ stock
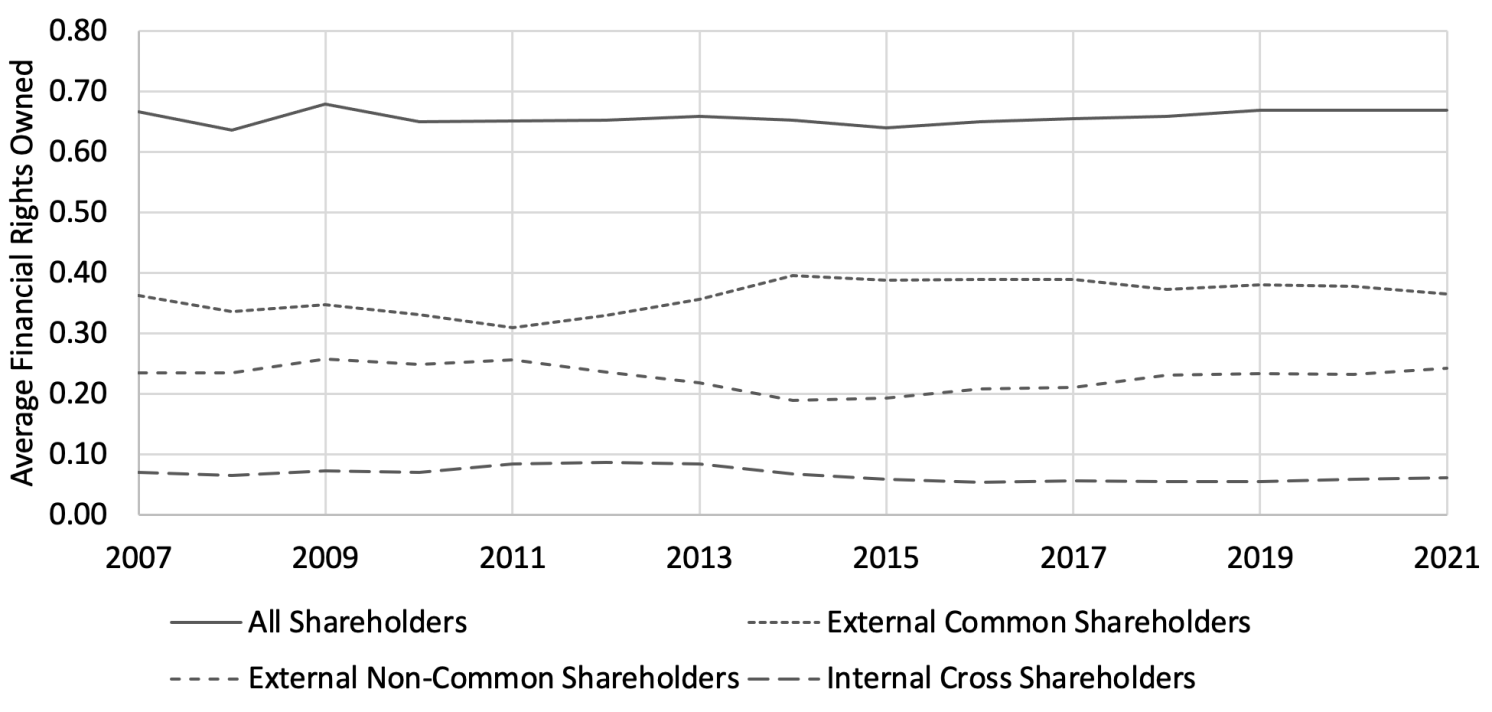

Source: Refinitiv Eikon and own calculations
The evolution of profit weights attached to rival firms
At first sight, the patterns in Figure 2 suggest that cross-ownership links are relatively unimportant compared with common ownership links. To evaluate this, we use the ownership data to compute the profit weights attached by managers to rival firms, for each manufacturer pair and year. Computing profit weights requires an assumption on how financial rights are mapped into voting or control rights. Following the literature, our baseline analysis measures control rights by the financial rights of the large shareholders. This assumes a one-share, one-vote rule for the large investors, while the remaining shareholders are assumed to be atomistic and have no control rights. As a robustness check, we also measure the control rights by the normalised Banzhaf power indices that result from the shareholders’ voting rights. 2
The dashed lines in Figure 3 show the evolution of the average profit weights, based on both measures: voting rights (panel A) and Banzhaf power indices (panel B). The solid lines report the profit weights without accounting for the cross-ownership links in the industry, as has been done in the previous literature. 3 Both panels reveal a similar picture:
- The average profit weight increased steadily over time until 2017, and has decreased slightly since then.
- The average profit weight is lower when compared to the set of S&P 500 US firms, consistent with the evidence in Boot et al. (2022), as US asset managers typically hold smaller stages in non-US firms.
- Most interestingly for our purposes, accounting for cross-ownership links turns out to be important, despite the relatively modest extent of these links (as seen earlier in Figure 2). No accounting for cross-ownership links, i.e. computing profit weights as if all shareholders where external to the industry (even the internal ones), underestimates the average profit weight by 41%–105%.
Figure 3 Evolution of profits weights attached to rival firms, as implied by common and cross-ownership
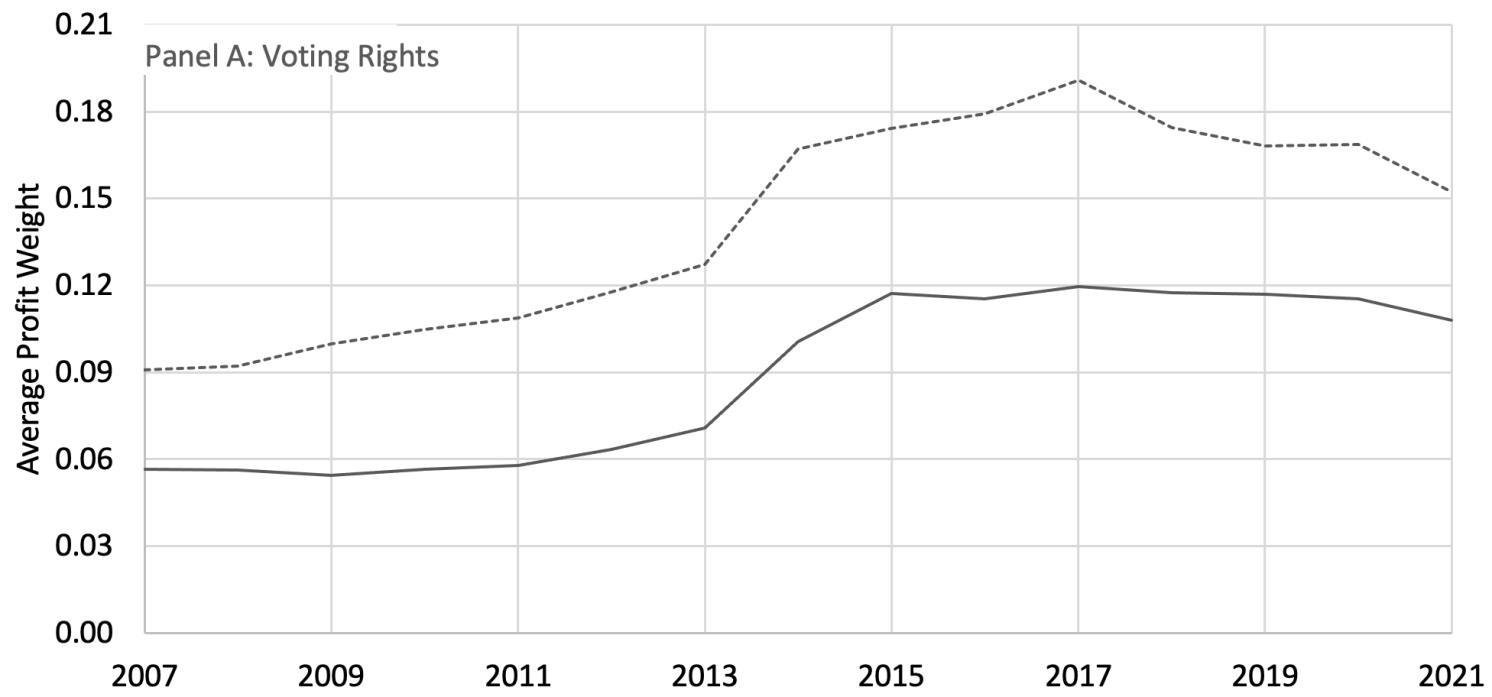

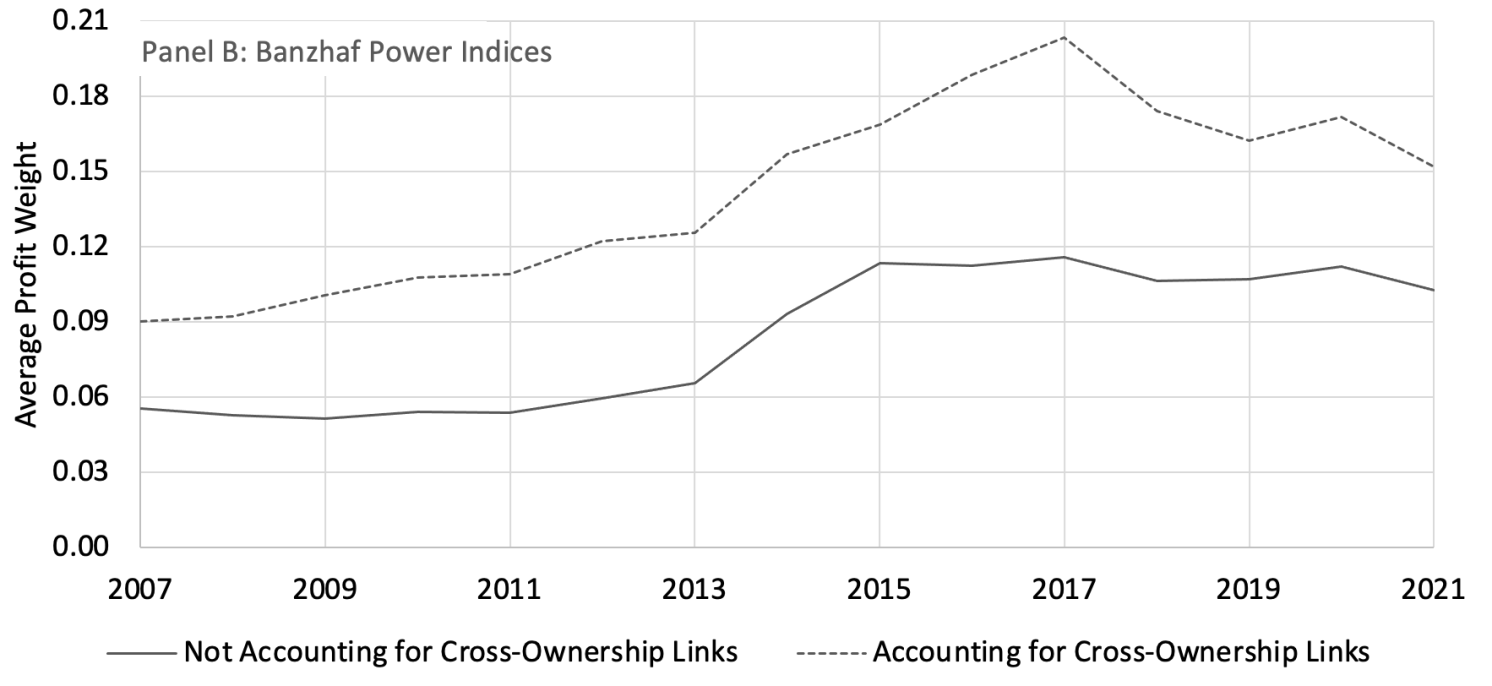

Source: Refinitiv Eikon and own calculations
Summary and policy implications
Common-ownership links amount to 31%–40% of the automobile manufacturers’ stock, while cross-ownership links amount to a more modest 5%–9%. Nevertheless, the cross-ownership links matter considerably for profit weights that managers may assign to the profits of their competitors. We find that not accounting for cross-ownership (i.e. treating it as common ownership) underestimates the average weight assigned by managers to the profit of competitors by 41%–105%. This is robust to different assumptions on how financial rights translate into control rights. One way of interpreting this is that cross-ownership is another channel by which the managers of a corporation account for the interests of another corporation within the same industry.
These findings have important implications for competition policy and antitrust enforcement. First, competition agencies should account for cross-ownership when calculating indicators used to screen unilateral anti-competitive effects. Second, cross-ownership ought to play an important role in the rethinking of antitrust enforcement stimulated by the rise in overlapping ownership.
This blog post is based on data from the recently published Voxeu.


")


")


.jpeg")


")


")


")


")
")

")