Cities are warming faster than their rural surroundings. But the ecosystem support provided by urban forestry is often omitted from climate policies due to the difficulty in assigning to it a credible monetary sum. This column estimates the value of urban trees. By exploiting an ecological catastrophe – an infestation of exotic beetles in the trees of Toronto, Canada – the authors are able to quantify the ecological and economic value of urban forestry, providing detailed evidence that a city’s trees reduce energy consumption and moderate temperatures during heatwaves.
Many cities are not cool – primarily due to global factors such as climate change and atmospheric pollution, as well as local factors like land use and population density. This phenomenon is known as the ‘urban heat island effect’: cities are warmer, and warming faster, than rural hinterlands because of human activities and infrastructure. For instance, against the backdrop of rising global temperatures, North American cities saw a more than 3° Celsius increase in summer temperatures between 1985 and 2020. One factor that helps mitigate urban heat is urban forestry: North American cities that enhanced their green infrastructure experience less warming (Akbari and Taha 1992, Nikoofard et al. 2011).
Ecosystem services like those from urban trees are often omitted from climate policies due to difficulties in placing a credible monetary value on urban green infrastructures, which are not traded in the market. This is concerning because many of the climate mitigation and adaptation strategies could require the conversion of ecosystems such as green infrastructure into other land uses (Druckenmiller 2022). The aim of our recent paper (Han et al. 2023) is to quantify the ecological and economic value of urban trees by exploiting an ecological catastrophe – Emerald Ash Borer (EAB) infestation in Canada’s Greater Toronto Area.
Figure 1 Tree canopy, temperature, and the Emerald Ash Borer infestation in Toronto


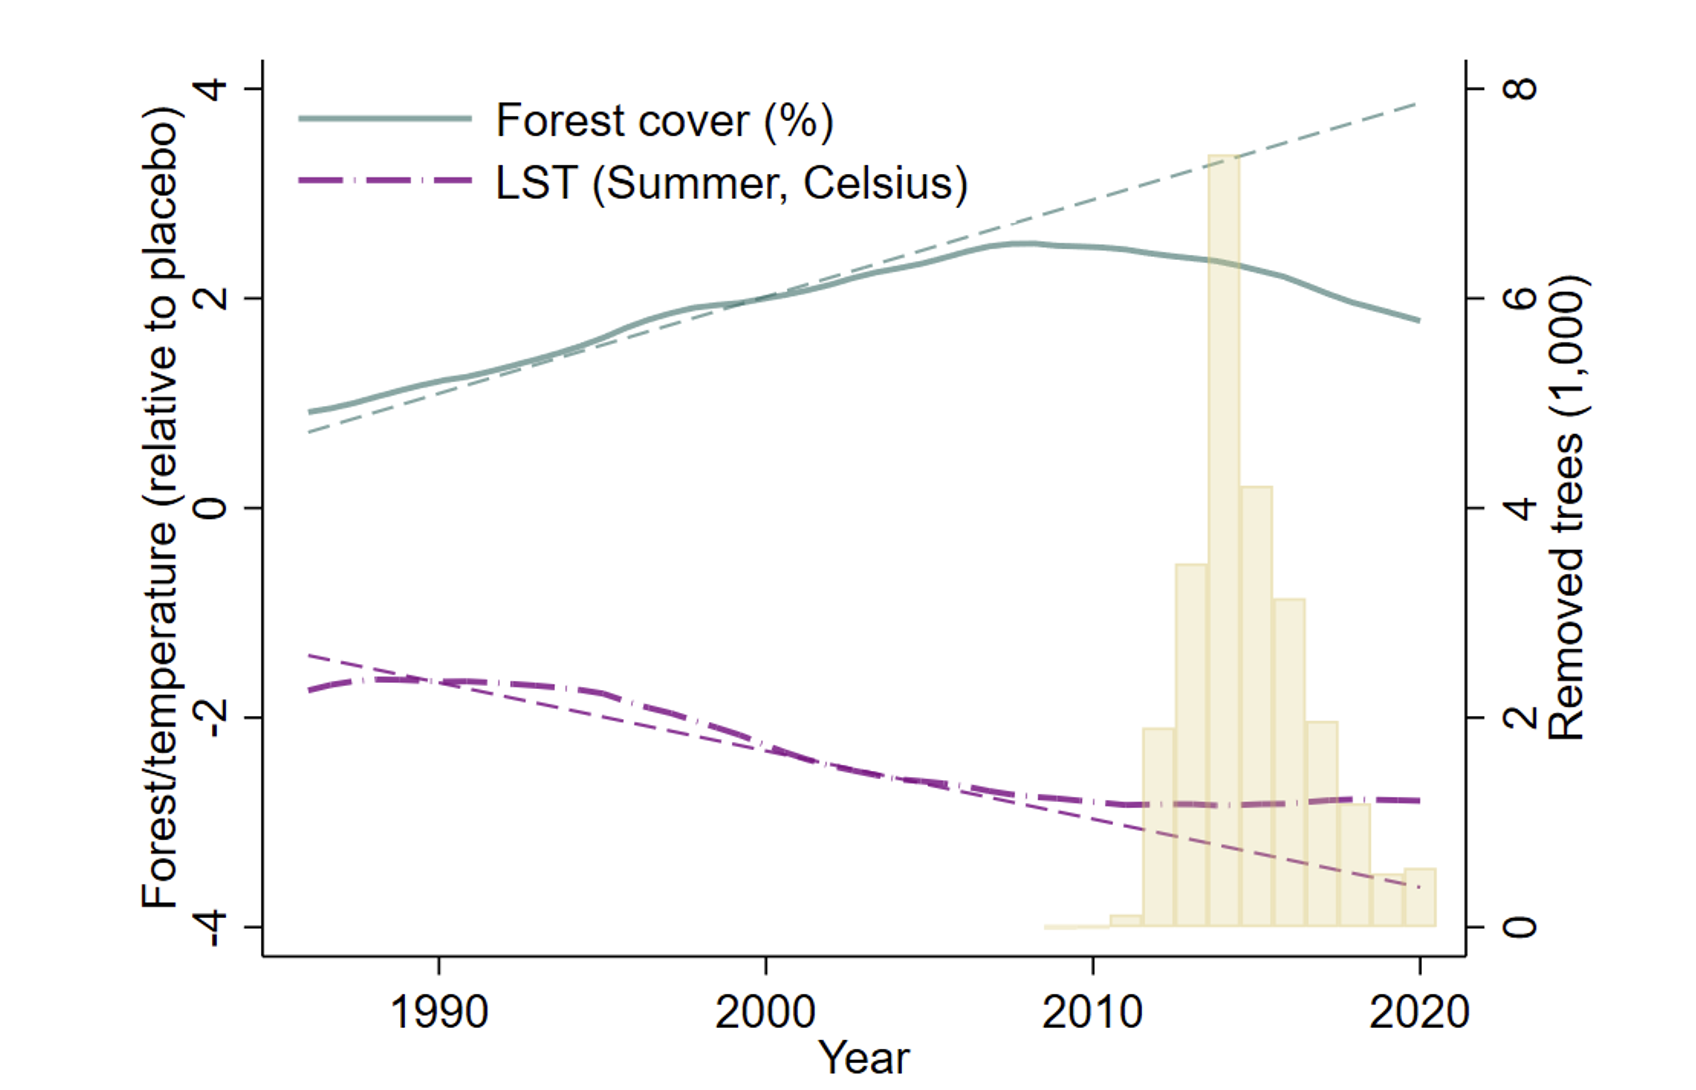

Notes: This figure presents a local polynomial fit for the annual difference in forest cover (percentage points, green and solid line) and average Land Surface Temperature during summer months (Celsius degrees, purple and long-dashed line) between Toronto and a placebo group of non-Northeastern cities, defined as all Canadian and US cities except those situated North and East of the most western and southern location of Illinois. The dashed lines show the best linear fit for these differences from 1985 to 2010. Additionally, the figure includes the yearly number of publicly managed ash trees removed in Toronto (in thousands), based on a register of all tree-maintenance orders from the city’s Parks and Forestry department.
Emerald Ash Borer infestation poses a significant challenge for urban forestry, yet it also provides a fascinating opportunity for estimating the value of urban trees for two reasons. First, while Toronto was actively increasing its green infrastructure, the pest contributed to undoing decades of progress compared to other North American cities (see Figure 1). The city anticipated losing a substantial portion of its 860,000 ash trees, which make up about 8% of the tree canopy cover across both public and private land, with notable variation within and across neighbourhoods. Second, the EAB, originally native to Asia, was inadvertently introduced to North America during the summer of 2002, and exclusively feeds on ash trees. Consequently, the spatial distribution of ash trees versus other common urban tree species allows us to isolate exogenous variation in neighbourhood tree canopy changes. This empirical strategy focuses on local, within city variation, contrasting sharply with another recent study that leveraged climatic variations affecting bark beetle survival rates to value tree mortality in the western US (Druckenmiller 2023).
To quantify the value of these urban trees (and their ecosystem services) and isolate exposure to EAB infestation within each of the city’s 45,000 postal codes, we collect comprehensive urban forest assessments covering Toronto between 2007 and 2018, and combine this with a unique, geo-referenced register of all city-managed urban trees, which reports tree species, maintenance dates, and cut downs. We then combine the tree data with exhaustive data on residential property transactions between 2007 and 2018, and a monthly panel of electricity and gas meter readings to complete the picture.
Figure 2 Initial allocation of ash trees and neighbourhood characteristics


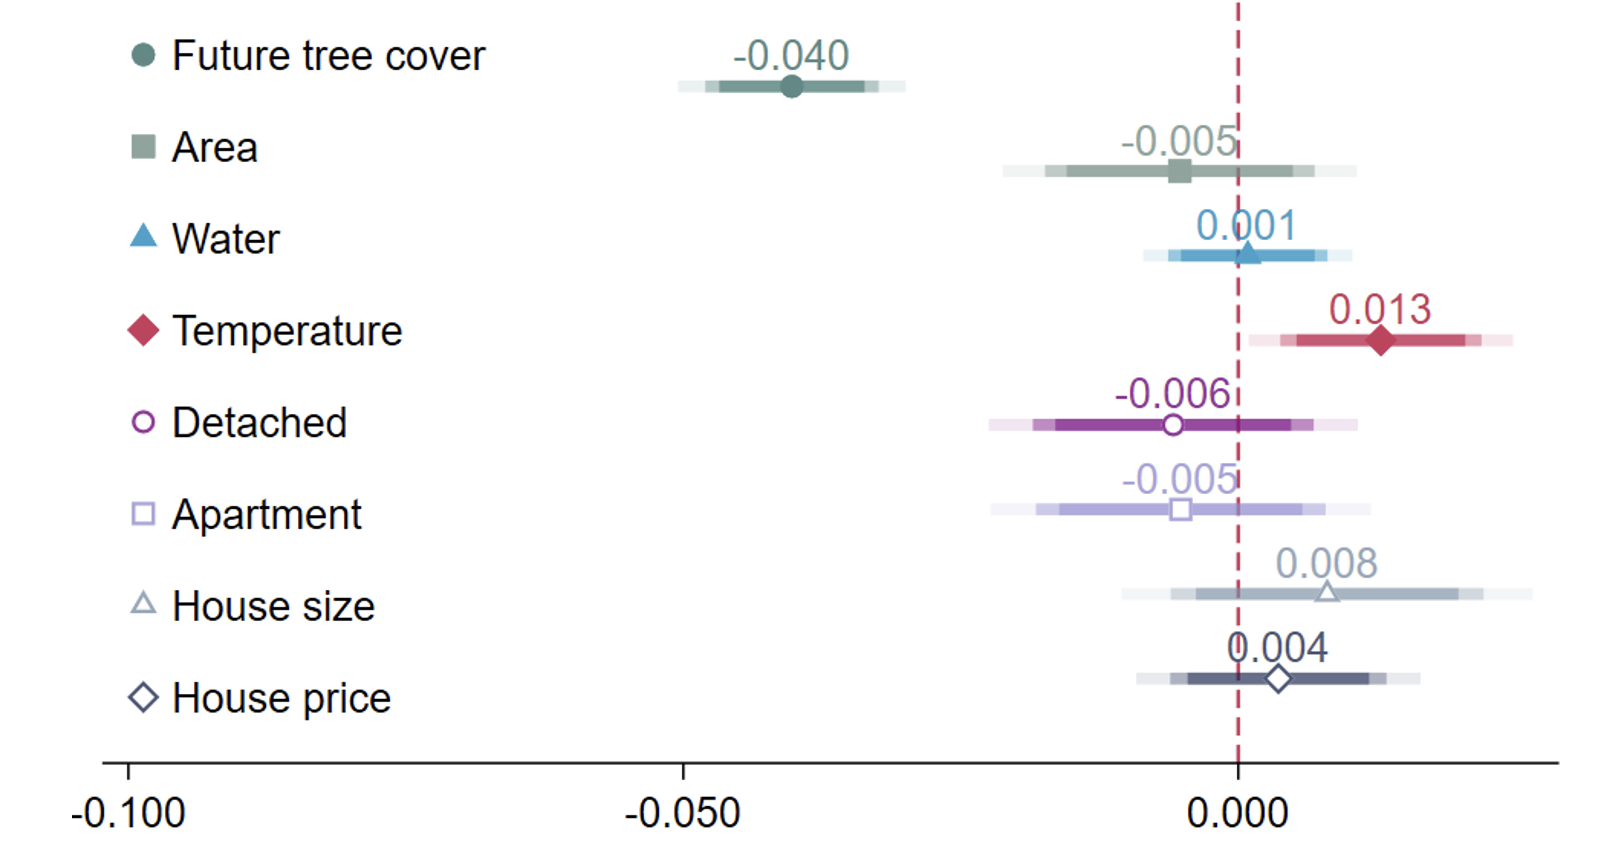

Notes: Figure displays the standardised estimates of regressions relating neighbourhood characteristics and attributes with the initial density of publicly maintained ash trees. The neighbourhood characteristics are: standardised difference in area share of urban forestry within the postcode between 2007 and 2018; (log) area of the postal code; area share of water within the postcode in 2007; share of detached properties sold in 2007-2008; share of multi-stories properties sold during the same period; property size (as captured by the average number of rooms across transactions); and average (log) property price within the postal code in 2007-2008. For the sake of exposition, we standardise the treatment (the density of publicly maintained ash trees) and all outcomes. The darker band represents a 10% confidence interval, the medium band shows a 5% confidence interval, and the lighter band represents the 1% confidence interval.
The key empirical challenge in valuing urban forestry lies in establishing a causal link between tree canopies and house prices. One may be concerned that leafy neighbourhoods tend to be established areas with better unobservable amenities such as superior school quality, which would bias the correlation between tree density and property value upward. Conversely, in highly sought-after, densely populated neighbourhoods, the opportunity cost of land may be greater, potentially causing a downward bias. To mitigate these concerns and establish causality, we employ an instrumental variable approach, explaining the evolution of the tree canopy within a postal code by its exogenous exposure to EAB infestation. Figure 2 illustrates the strong correlation between the initial allocation of city-managed ash trees and future changes in urban forestry, and the weak correlation with other neighbourhood characteristics (for a given density of city-managed trees).
Our findings reveal that an additional tree per postcode boosts property prices by 0.45%; alternatively, one additional percentage point in tree cover within a postcode elevates property values by 1%. Neighbourhoods where ash trees constituted most city-managed trees prior to the infestation witnessed a staggering 7 percentage point reduction in tree cover and a 7% drop in property prices.
The hedonic value of trees is a composite measure that combines their aesthetic appeal with the value of ecosystem services, such as cooling potential and energy consumption reduction, as well as reductions in local pollution. We extend our estimation to quantify the effects of urban trees on three aspects of ecosystem services: urban temperature, energy consumption, and air pollution. Heatwaves trigger spikes in energy consumption, and these surges are mitigated in neighbourhoods with a generous tree canopy. Our analysis reveals that one additional percentage point of tree cover within a postal code results in a 0.05° Celsius reduction in the local average Land Surface Temperature (LST) during the months of July and August. This decrease in temperature translates into a reduction in energy consumption of roughly 2.5%, corresponding to a monthly cost saving of CA$5 during this two-month period. We utilise these estimates to place a monetary value on the role of trees in alleviating urban heat island effects under varying scenarios, encompassing more and less conservative climate change projections. The findings reveal substantial energy savings attributed to urban trees. Most importantly, the monetary value of this one tree service already exceeds the annual maintenance costs per tree. This is but a portion of the total hedonic value associated with trees, underscoring that urban trees provide a highly cost-effective way to regulate temperatures in urban areas.
Our study not only quantifies the amenity value of urban trees, but also illustrates that the valuation of urban forestry is nonlinear, with the marginal effect only manifesting in areas with a substantial existing tree cover. This is consistent with Ziter et al. (2019), who show that temperature reduction is nonlinear with increasing canopy cover, with the cooling effect becoming more significant when the canopy cover exceeds 40%. Considering that cities or neighbourhoods with limited green infrastructure often represent economically disadvantaged areas, policy interventions directed towards such cities or regions have the potential to address not only coordination challenges but also to generate significant redistributive effects.
By leveraging the ecological disaster of EAB infestation in the Greater Toronto Area, our research offers causal estimates of the multifaceted value of urban trees. These findings provide compelling evidence for the importance of including urban forestry in urban development plans and climate change mitigation strategies. Moreover, we demonstrate that these findings extend beyond Toronto and resonate across North American cities. This underscores the broader applicability of the study and emphasises the universal benefit of urban trees in enhancing urban living environments and mitigating the impact of climate change.
Source : Voxeu


