The COVID-19 pandemic brought a large, lasting shift to work from home (Barrero et al. 2021b, Aksoy et al. 2022, and Schwellnus et al. 2022). Clearly, this shift reduces the amount of time that workers spend commuting. But how much time does work from home actually save? And how do workers allocate their time savings?
The Global Survey of Working Arrangements
To address these questions, we tap our Global Survey of Working Arrangements (G-SWA), which yields individual-level data on demographics, work-from-home levels during the pandemic, employer plans for work-from-home levels after the pandemic, commute times, and more. We consider workers aged 20–59 who finished primary school, quantify their commute time savings associated with work from home, and provide evidence on how they use their time savings. Thus far, we have fielded the survey across 27 countries in two waves, one in late July/early August 2021 and one in late January/early February 2022. As we discuss in Aksoy et al. (2022), the Global Survey of Working Arrangements samples skew to better-educated persons, less so in most rich countries but very strongly so in middle-income countries.
Measuring commute time savings
We measure time savings when working from home as follows. In the first wave we ask: “In 2019 (before COVID) how long was your typical commute to work in minutes (one-way)?” In the second wave we ask: “How long do you usually spend commuting to and from work (in minutes). If you are not currently commuting to work, please answer based on your commute time in 2019 (before COVID)”. We obtain daily commute time by doubling the one-way commute time in the first wave and summing times to and from work in the second wave.
For those who worked mainly from home at some point during the pandemic, we obtain their allocation of time savings by asking:
During the COVID-19 pandemic, while you have been working from home, how are you now spending the time you have saved by not commuting? Please assign a percentage to each activity (the total should add up to 100%).
- Working on your current or primary job
- Working on a second or new secondary job
- Childcare, home schooling, and/or caring for other relatives
- Home improvement, chores, or shopping
- Leisure indoors (e.g. reading, watching TV and movies)
- Exercise or outdoor leisure
Using the responses, we calculate the percentages of time savings devoted to jobs (1 + 2), leisure (5 + 6) and caregiving activities (3). Multiplying these percentages by total daily time savings when working from home yields the extra minutes allocated to each activity.
To obtain data on work-from-home days per week as of the survey week, we ask: “How many full paid days are you working from home this week?” Response options range from 0 to 5+ days per week. To obtain data on planned work-from-home levels, we ask: “After COVID, in 2022 and later, how often is your employer planning for you to work full days at home?” If the worker says his or her employer has neither discussed the matter nor announced a policy regarding work from home, we assign a zero value.
Daily commute times
Figure 1 reports country-level conditional mean values for the daily savings in commute time when working from home. We use regression methods to control for cross-country differences in the age, gender, and education distributions and treat the US mean as the baseline value. Conditional mean daily-commute times range from 51 minutes in Serbia, 54 in Poland, and 55 in US at the lower end to 99 minutes in India, 100 in Japan, and 102 in China at the upper end. Mean daily time savings when working from home exceed one hour in 23 of 27 countries. The simple average of these country-level conditional means is 72 minutes of time savings per day.
Figure 1 Country-level commute time savings, conditional means
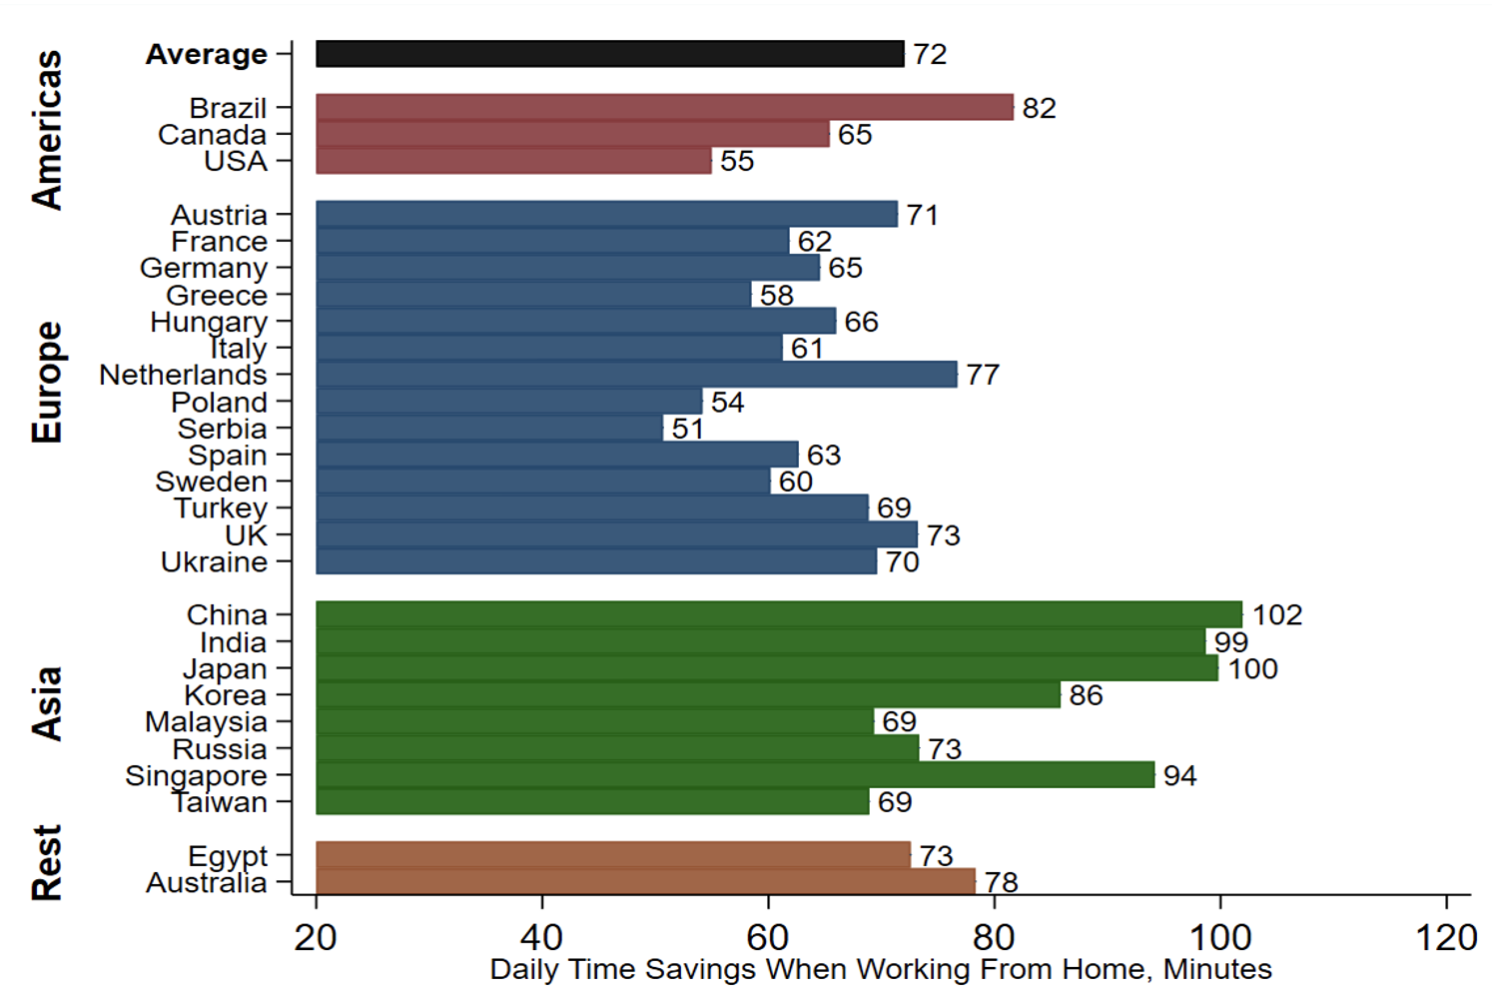

Notes: The figure shows coefficients on country dummies in OLS regressions that control for gender, age groups (20–29, 30–39, 40–49, 50–59), education (secondary, tertiary, graduate), and a survey wave fixed effect, treating the raw US mean as the baseline value. We fit the regression to data for 18,995 Global Survey of Working Arrangements respondents surveyed in mid-2021 and early 2022 who worked mainly from home at some point during the COVID-19 pandemic. The ‘Average’ value is the simple mean of the country-level values. Sources: Aksoy et al. (2023) and Global Survey of Working Arrangements.
How much time savings per worker?
As of the survey week, both men and women worked about 1.7 full days at home, on average. Employer plans imply that there will be about half as many work-from-home days per week after the pandemic ends. Combining these results with the daily time savings in Figure 1, our data say that work from home saved about two hours per week per worker in 2021 and 2022, and that it will save about one hour per week per worker after the pandemic ends. That is equivalent to 2.2% of a 46-hour workweek, the sum of 40 paid hours and six hours of commuting. The time savings will tend to be smaller in countries with shorter commutes and in countries with a smaller share of highly educated workers (because less-educated workers work from home less).
How do workers allocate these time savings?
Figure 2 shows that, on average, 40% of commute time savings go to extra work on primary and secondary jobs. Another 34% goes to leisure, and 11% goes to caregiving activities. These results are broadly similar to the findings in Barrero et al. (2020) for the US and in Hensher et al. (2022) for Australia. Returning to our data, extra work time on primary and secondary jobs absorbs 53% of the time savings in Malaysia, Singapore, and Taiwan but less than 35% in Germany, Greece, Japan, Italy, Poland, and Spain. Respondents in Austria, Spain, and Germany allocate more than 40% of their time savings to leisure. Extra caregiving activities absorb only 6% of time savings in Singapore and South Korea, as compared to 15% or more in Greece, Italy, Poland, and Serbia.
Figure 2 Allocation of commute time savings, country-level conditional means
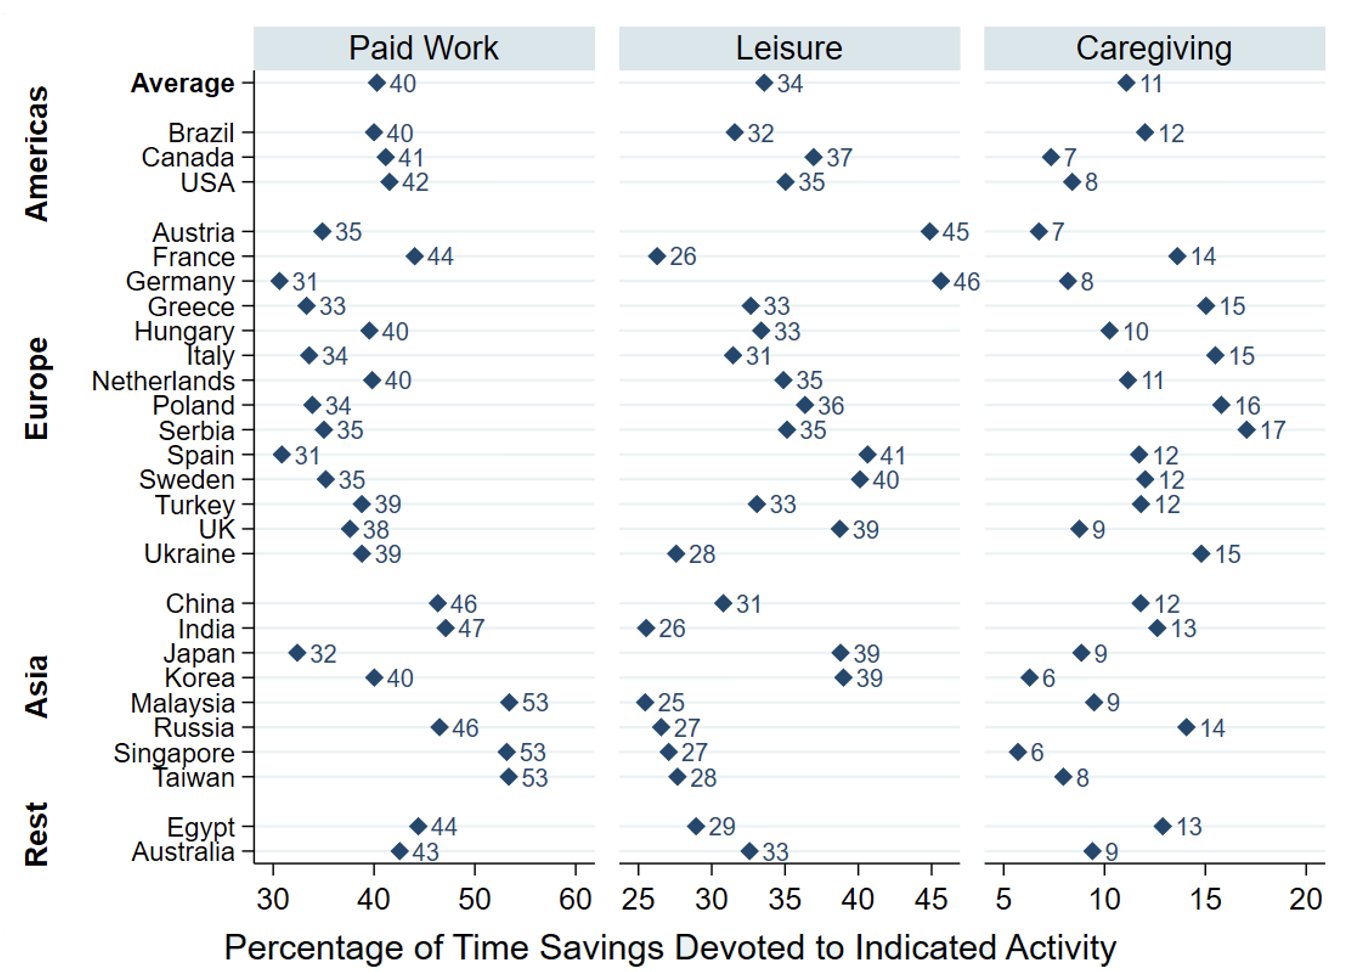

Notes: The figure shows coefficients on country dummies in OLS regressions that control for gender, age groups (20–29, 30–39, 40–49, 50–59), education (secondary, tertiary, graduate), and a survey wave fixed effect, treating the raw US mean as the baseline value. We fit the regression to data for 18,995 Global Survey of Working Arrangements respondents surveyed in mid-2021 and early 2022 who worked mainly from home at some point during the COVID-19 pandemic. The ‘Average’ value is the simple mean of the country-level values. Sources: Aksoy (2023) and Global Survey of Working Arrangements.
Average daily time savings by demographic characteristics
Figure 3 shows how commute times vary with demographic characteristics. Average daily commutes are about 10 minutes longer for highly educated workers (tertiary or graduate degree) than for those with a primary or secondary education. Perhaps the most noteworthy aspect of Figure 3 is how little the average daily commute times vary with demographic characteristics. In contrast, the incidence of avoided commutes due to working from home rises strongly with educational attainment (and earnings), as Barrero et al. (2021b) show for the US.
Figure 3 Average daily commute times, unconditional means by demographics
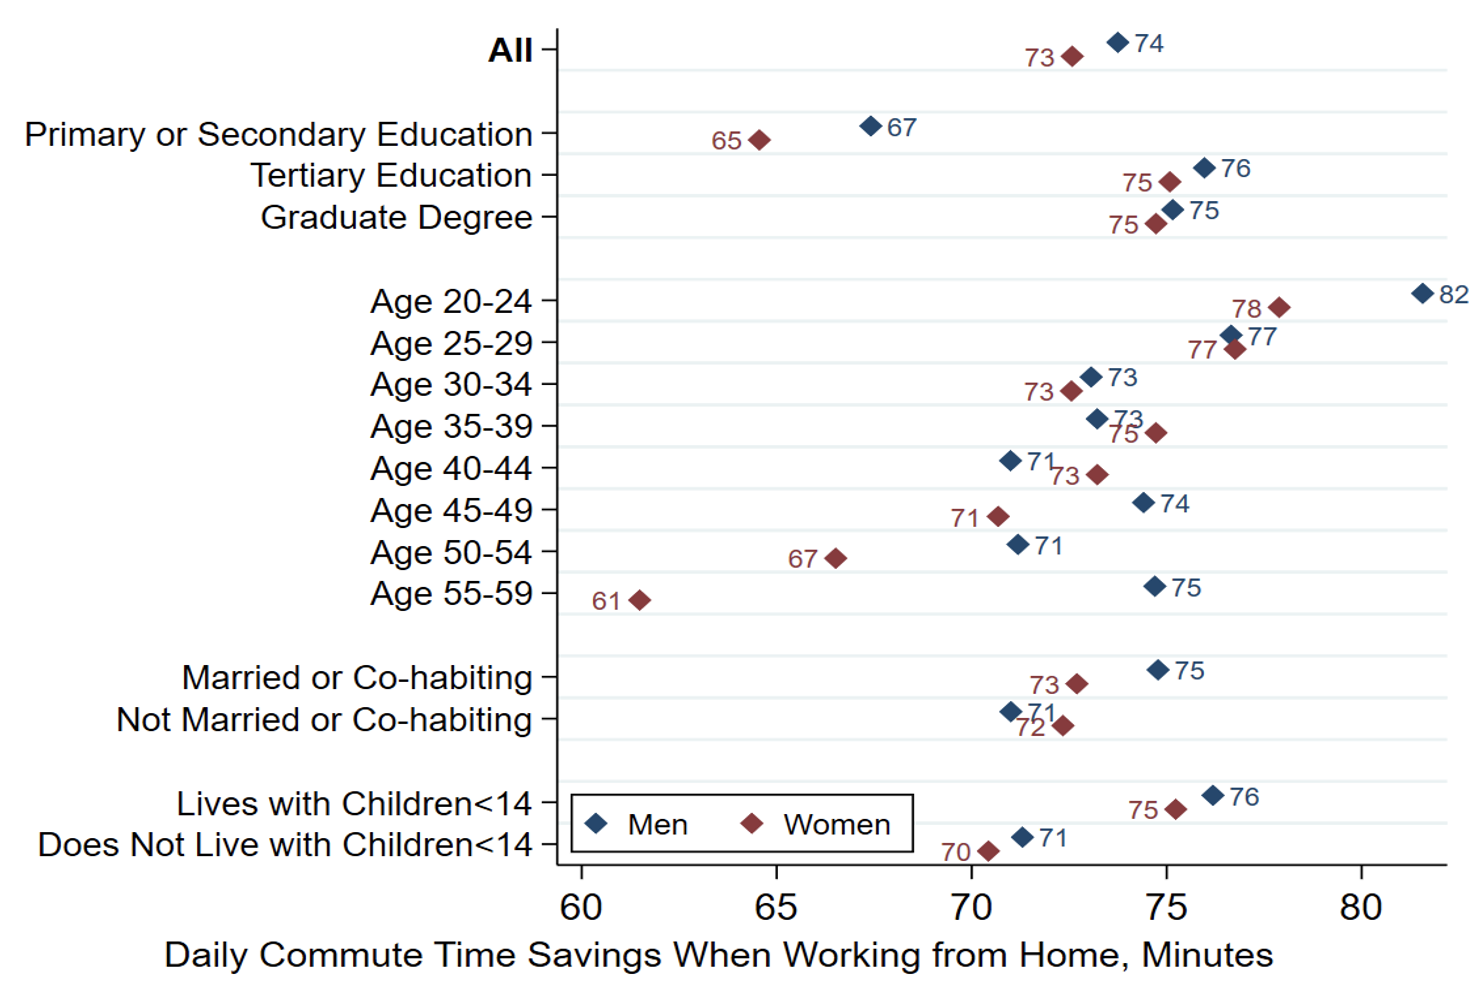

Notes: The figure reports unconditional means of daily commute times among those who worked mainly from home at some point during the COVID-19 pandemic, based on 19,027 Global Survey of Working Arrangements respondents. The education category refers to the highest level attained. We weight each individual-level observation equally in computing the means in this table. Weighting each country equally yields similar results. Sources: Aksoy et al. (2023) and Global Survey of Working Arrangements.
Correlates of daily time savings allocation
Figure 4 provides information on how the time savings allocated to jobs, leisure, and caregiving vary with demographics. Some interesting patterns emerge. Living with children under 14 has large effects on the allocation of commute time savings. Women with children devote an extra 11.4 minutes of their daily time savings to caregiving activities, relative to the omitted group. For men, the corresponding figure is 9.0 (11.4 – 0.7 – 1.7) minutes. Perhaps surprisingly, differences between men and women in how they allocate their time savings are modest. While men devote more time savings to their jobs, the daily difference is only 2.4 minutes. Men also devote about two more minutes of time savings to leisure. Relative to men, women allocate an extra 0.7 minutes of their daily time savings to caregiving when there are no children under 14 in the household and an extra 2.4 minutes when there are.
Figure 4 How the time savings allocation varies with individual characteristics

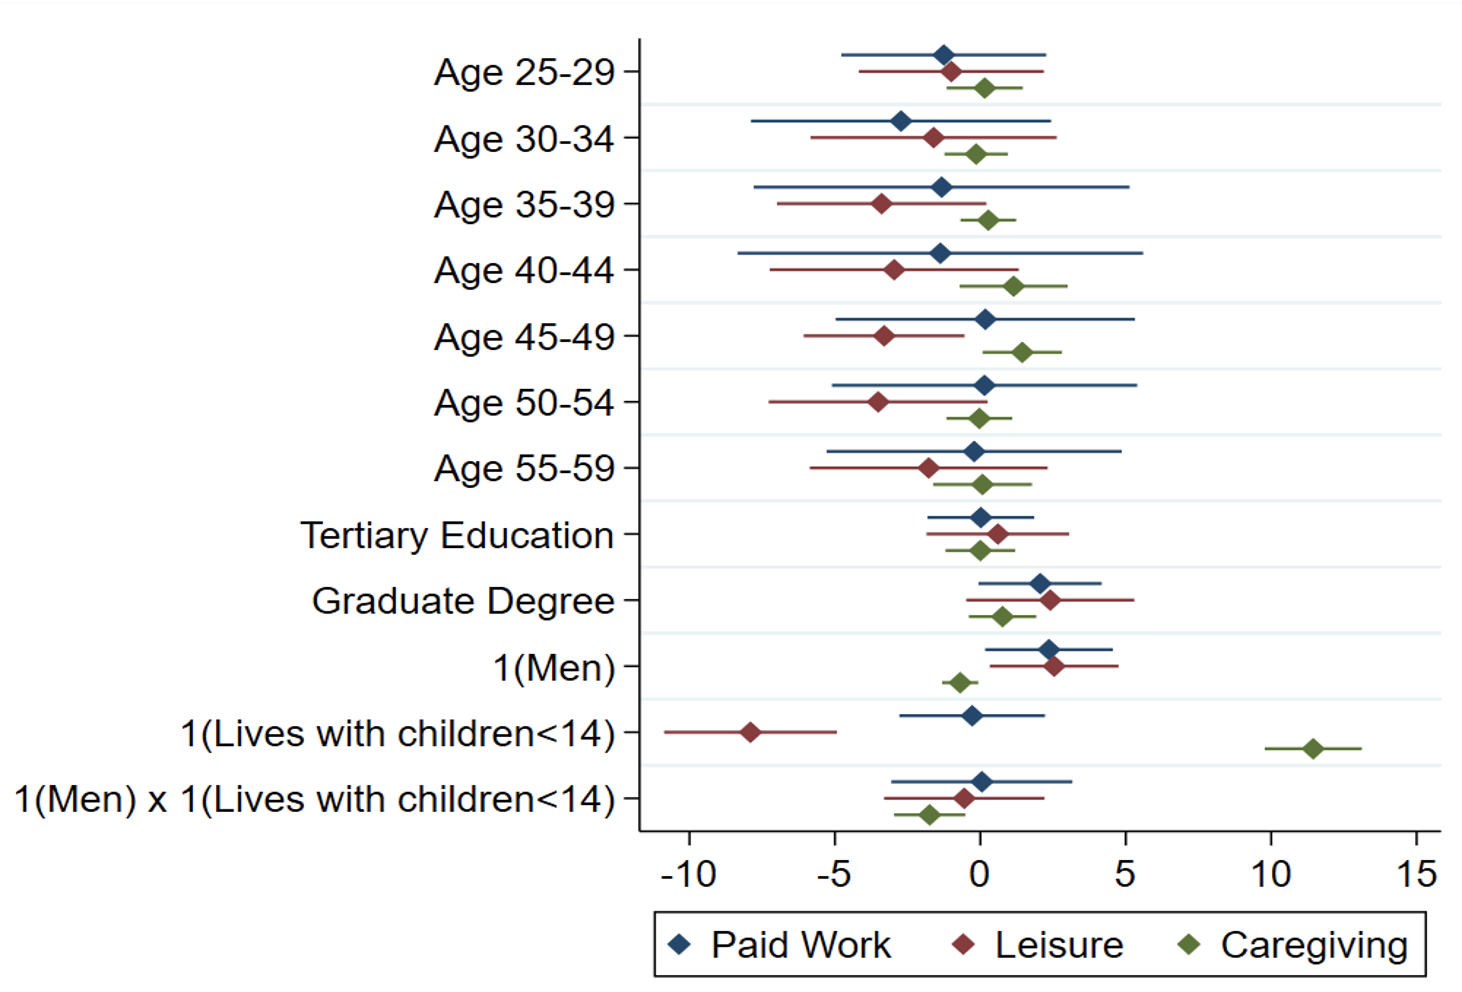
Notes: The figure reports OLS regression estimates in Global Survey of Working Arrangements data. The omitted group are women aged 20 to 24 with a primary or secondary and who do not live with children under 14. All specifications include country fixed effects and a wave dummy. We cluster errors at the country level. Sources: Aksoy et al. (2023) and Global Survey of Working Arrangements.
Source :- CEPR


")


")


.jpeg")


")


")


")


")
")

")